The following table shows the hot dogs bought from a street vendor over the course of eight days ("Demand"). Also shown is the temperature for each Temperature (°C) 20 11 23 19 Demand 49 32 36 40 5 17 10 21 16 44 20 34 a. Calculate the slope and y-intercept for the linear regression equation for these data. ŷ=+x (Round to two decimal places as needed.)
The following table shows the hot dogs bought from a street vendor over the course of eight days ("Demand"). Also shown is the temperature for each Temperature (°C) 20 11 23 19 Demand 49 32 36 40 5 17 10 21 16 44 20 34 a. Calculate the slope and y-intercept for the linear regression equation for these data. ŷ=+x (Round to two decimal places as needed.)

Functions and Change: A Modeling Approach to College Algebra (MindTap Course List)
6th Edition
ISBN:9781337111348
Author:Bruce Crauder, Benny Evans, Alan Noell
Publisher:Bruce Crauder, Benny Evans, Alan Noell
Chapter5: A Survey Of Other Common Functions
Section5.6: Higher-degree Polynomials And Rational Functions
Problem 1TU: The following fictitious table shows kryptonite price, in dollar per gram, t years after 2006. t=...

Related questions
Question
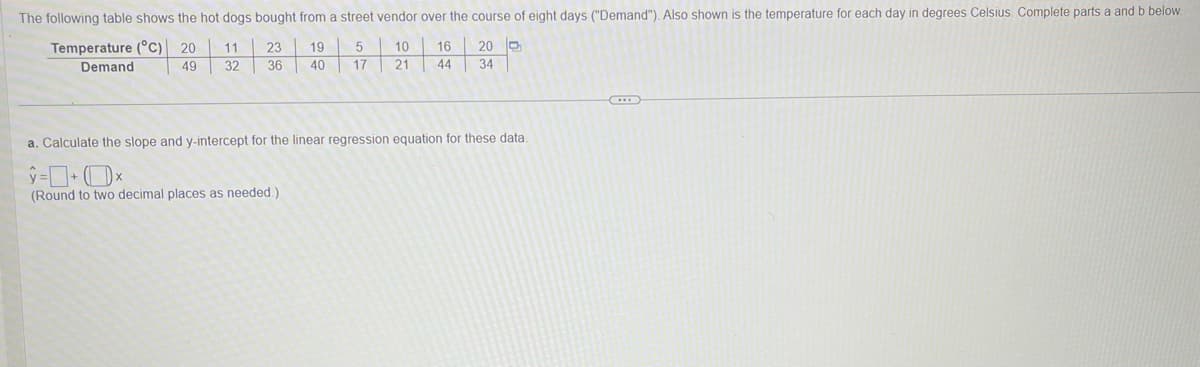
Transcribed Image Text:The following table shows the hot dogs bought from a street vendor over the course of eight days ("Demand"). Also shown is the temperature for each day in degrees Celsius. Complete parts a and b below.
Temperature (°C) 20
Demand
49
11 23
32 36
19
40
5
17
10
21
16
44
20 D
34
a. Calculate the slope and y-intercept for the linear regression equation for these data.
ŷ=+*
(Round to two decimal places as needed.)
Expert Solution
This question has been solved!
Explore an expertly crafted, step-by-step solution for a thorough understanding of key concepts.

This is a popular solution!

Trending now
This is a popular solution!

Step by step
Solved in 2 steps with 2 images

Recommended textbooks for you
Functions and Change: A Modeling Approach to Coll…
Algebra
ISBN:
9781337111348
Author:
Bruce Crauder, Benny Evans, Alan Noell
Publisher:
Cengage Learning


Algebra & Trigonometry with Analytic Geometry
Algebra
ISBN:
9781133382119
Author:
Swokowski
Publisher:
Cengage
Functions and Change: A Modeling Approach to Coll…
Algebra
ISBN:
9781337111348
Author:
Bruce Crauder, Benny Evans, Alan Noell
Publisher:
Cengage Learning
Algebra & Trigonometry with Analytic Geometry
Algebra
ISBN:
9781133382119
Author:
Swokowski
Publisher:
Cengage

Linear Algebra: A Modern Introduction
Algebra
ISBN:
9781285463247
Author:
David Poole
Publisher:
Cengage Learning

College Algebra
Algebra
ISBN:
9781305115545
Author:
James Stewart, Lothar Redlin, Saleem Watson
Publisher:
Cengage Learning

Algebra and Trigonometry (MindTap Course List)
Algebra
ISBN:
9781305071742
Author:
James Stewart, Lothar Redlin, Saleem Watson
Publisher:
Cengage Learning