The investigators for a study collected standardized data on timed 24-hour urinary excretion for 10,079 men and women from 52 population samples in 32 countries. One of the goals of the study was to quantify the relationship between 24-hour urinary Na (y) and estimated 24-hour urinary Na (x) obtained from casual urine specimens at one point in time. The investigators presented a simple linear regression of y on x, separately for men and women. The regression equation for men was: Y = 1.09x - 7.11, with R2 = 0.26, n = 1,369 Hint: Assume that a t distribution with > 200 df is the same as a N(0, 1) distribution. You can use the Distribution Calculators page in SALT to find critical values and/or p-values to answer parts of this question. (a) What does the R2 of 0.26 mean in words? OR² = 0.26 means that about 74% of the time the estimated 24-hour urinary Na matches the 24-hour urinary Na obtain from casual urine specimens at one point in time. O R² = 0.26 means that about 26% of the variation in 24-hour urinary Na can be explained by estimated 24-hour urinary Na obtain from casual urine specimens at one point in time. O R² = 0.26 means that about 26% of the time the estimated 24-hour urinary Na matches the 24-hour urinary Na obtain from casual urine specimens at one point in time. OR² = 0.26 means that about 74% of the variation in 24-hour urinary Na can be explained by estimated 24-hour urinary Na obtain from casual urine specimens at one point in time. (b) What is a two-sided p-value for the regression? (Round your answer to four decimal places.) (c) What is the estimated standard error of the slope estimate? (Hint: Use the t test for simple linear regression. Round your answer to four decimal places.)
The investigators for a study collected standardized data on timed 24-hour urinary excretion for 10,079 men and women from 52 population samples in 32 countries. One of the goals of the study was to quantify the relationship between 24-hour urinary Na (y) and estimated 24-hour urinary Na (x) obtained from casual urine specimens at one point in time. The investigators presented a simple linear regression of y on x, separately for men and women. The regression equation for men was: Y = 1.09x - 7.11, with R2 = 0.26, n = 1,369 Hint: Assume that a t distribution with > 200 df is the same as a N(0, 1) distribution. You can use the Distribution Calculators page in SALT to find critical values and/or p-values to answer parts of this question. (a) What does the R2 of 0.26 mean in words? OR² = 0.26 means that about 74% of the time the estimated 24-hour urinary Na matches the 24-hour urinary Na obtain from casual urine specimens at one point in time. O R² = 0.26 means that about 26% of the variation in 24-hour urinary Na can be explained by estimated 24-hour urinary Na obtain from casual urine specimens at one point in time. O R² = 0.26 means that about 26% of the time the estimated 24-hour urinary Na matches the 24-hour urinary Na obtain from casual urine specimens at one point in time. OR² = 0.26 means that about 74% of the variation in 24-hour urinary Na can be explained by estimated 24-hour urinary Na obtain from casual urine specimens at one point in time. (b) What is a two-sided p-value for the regression? (Round your answer to four decimal places.) (c) What is the estimated standard error of the slope estimate? (Hint: Use the t test for simple linear regression. Round your answer to four decimal places.)

Elementary Linear Algebra (MindTap Course List)
8th Edition
ISBN:9781305658004
Author:Ron Larson
Publisher:Ron Larson
Chapter2: Matrices
Section2.CR: Review Exercises
Problem 89CR: Cellular Phone Subscribers The table shows the numbers of cellular phone subscribers y in millions...

Related questions
Question
Transcribed Image Text:Hypertension
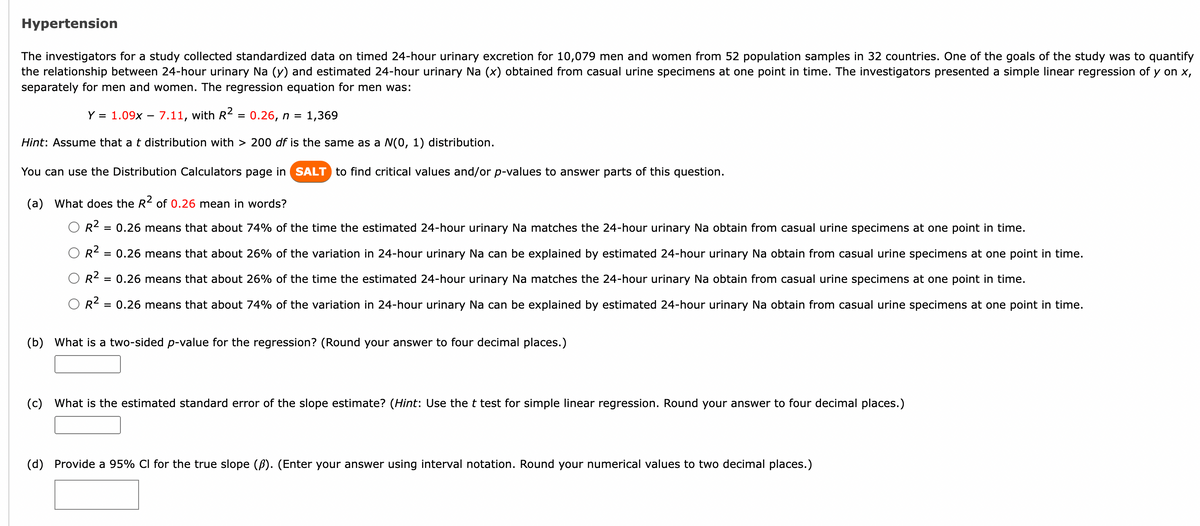
The investigators for a study collected standardized data on timed 24-hour urinary excretion for 10,079 men and women from 52 population samples in 32 countries. One of the goals of the study was to quantify
the relationship between 24-hour urinary Na (y) and estimated 24-hour urinary Na (x) obtained from casual urine specimens at one point in time. The investigators presented a simple linear regression of y on x,
separately for men and women. The regression equation for men was:
Y = 1.09x - 7.11, with R² = 0.26, n = 1,369
Hint: Assume that a t distribution with > 200 df is the same as a N(0, 1) distribution.
You can use the Distribution Calculators page in SALT to find critical values and/or p-values to answer parts of this question.
(a) What does the R² of 0.26 mean in words?
R²:
= 0.26 means that about 74% of the time the estimated 24-hour urinary Na matches the 24-hour urinary Na obtain from casual urine specimens at one point in time.
R² = 0.26 means that about 26% of the variation in 24-hour urinary Na can be explained by estimated 24-hour urinary Na obtain from casual urine specimens at one point in time.
R² = 0.26 means that about 26% of the time the estimated 24-hour urinary Na matches the 24-hour urinary Na obtain from casual urine specimens at one point in time.
OR²
= 0.26 means that about 74% of the variation in 24-hour urinary Na can be explained by estimated 24-hour urinary Na obtain from casual urine specimens at one point in time.
(b) What is a two-sided p-value for the regression? (Round your answer to four decimal places.)
(c) What is the estimated standard error of the slope estimate? (Hint: Use the t test for simple linear regression. Round your answer to four decimal places.)
(d) Provide a 95% CI for the true slope (B). (Enter your answer using interval notation. Round your numerical values to two decimal places.)
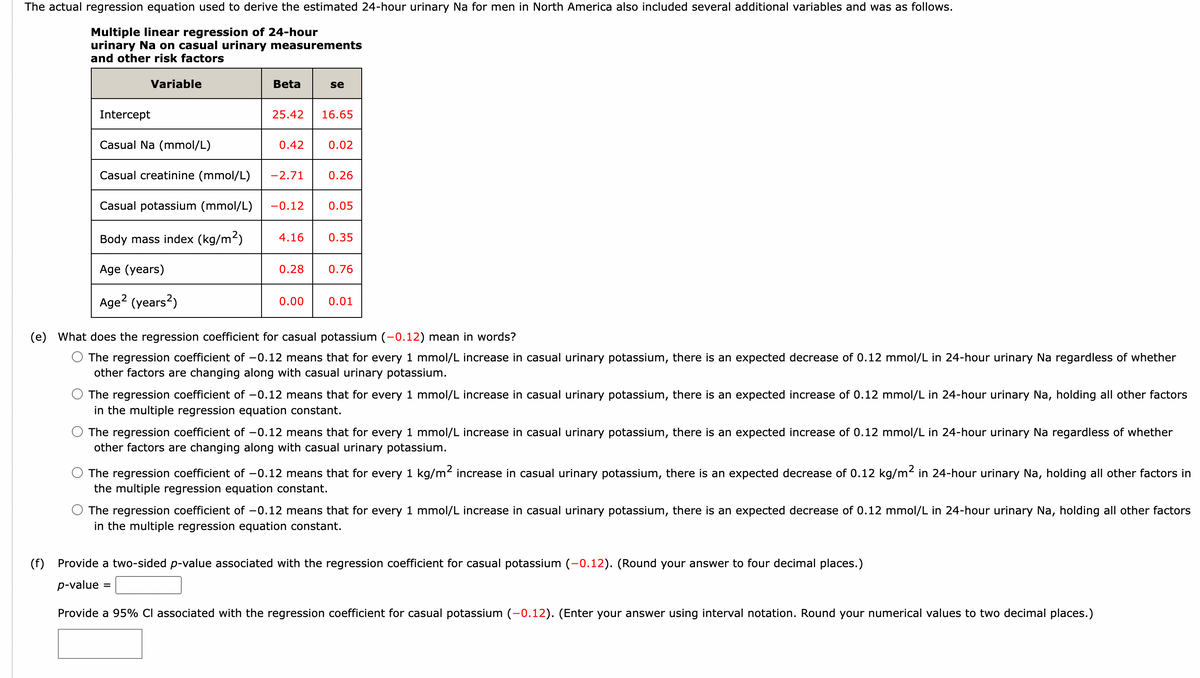
Transcribed Image Text:The actual regression equation used to derive the estimated 24-hour urinary Na for men in North America also included several additional variables and was as follows.
Multiple linear regression of 24-hour
urinary Na on casual urinary measurements
and other risk factors
Variable
Intercept
Casual Na (mmol/L)
Casual creatinine (mmol/L)
Casual potassium (mmol/L)
Body mass index (kg/m²)
Age (years)
Age² (years²)
Beta
25.42 16.65
0.42
-2.71
-0.12
=
se
0.28
0.00
0.02
0.26
4.16 0.35
0.05
0.76
0.01
(e) What does the regression coefficient for casual potassium (-0.12) mean in words?
The regression coefficient of -0.12 means that for every 1 mmol/L increase in casual urinary potassium, there is an expected decrease of 0.12 mmol/L in 24-hour urinary Na regardless of whether
other factors are changing along with casual urinary potassium.
The regression coefficient of -0.12 means that for every 1 mmol/L increase in casual urinary potassium, there is an expected increase of 0.12 mmol/L in 24-hour urinary Na, holding all other factors
in the multiple regression equation constant.
The regression coefficient of -0.12 means that for every 1 mmol/L increase in casual urinary potassium, there is an expected increase of 0.12 mmol/L in 24-hour urinary Na regardless of whether
other factors are changing along with casual urinary potassium.
The regression coefficient of -0.12 means that for every 1 kg/m² increase in casual urinary potassium, there is an expected decrease of 0.12 kg/m² in 24-hour urinary Na, holding all other factors in
the multiple regression equation constant.
The regression coefficient of -0.12 means that for every 1 mmol/L increase in casual urinary potassium, there is an expected decrease of 0.12 mmol/L in 24-hour urinary Na, holding all other factors
in the multiple regression equation constant.
(f) Provide a two-sided p-value associated with the regression coefficient for casual potassium (-0.12). (Round your answer to four decimal places.)
p-value
Provide a 95% Cl associated with the regression coefficient for casual potassium (-0.12). (Enter your answer using interval notation. Round your numerical values to two decimal places.)
Expert Solution
This question has been solved!
Explore an expertly crafted, step-by-step solution for a thorough understanding of key concepts.

This is a popular solution!

Trending now
This is a popular solution!

Step by step
Solved in 5 steps with 18 images

Recommended textbooks for you
Elementary Linear Algebra (MindTap Course List)
Algebra
ISBN:
9781305658004
Author:
Ron Larson
Publisher:
Cengage Learning

Functions and Change: A Modeling Approach to Coll…
Algebra
ISBN:
9781337111348
Author:
Bruce Crauder, Benny Evans, Alan Noell
Publisher:
Cengage Learning

Algebra and Trigonometry (MindTap Course List)
Algebra
ISBN:
9781305071742
Author:
James Stewart, Lothar Redlin, Saleem Watson
Publisher:
Cengage Learning
Elementary Linear Algebra (MindTap Course List)
Algebra
ISBN:
9781305658004
Author:
Ron Larson
Publisher:
Cengage Learning
Functions and Change: A Modeling Approach to Coll…
Algebra
ISBN:
9781337111348
Author:
Bruce Crauder, Benny Evans, Alan Noell
Publisher:
Cengage Learning
Algebra and Trigonometry (MindTap Course List)
Algebra
ISBN:
9781305071742
Author:
James Stewart, Lothar Redlin, Saleem Watson
Publisher:
Cengage Learning


Glencoe Algebra 1, Student Edition, 9780079039897…
Algebra
ISBN:
9780079039897
Author:
Carter
Publisher:
McGraw Hill