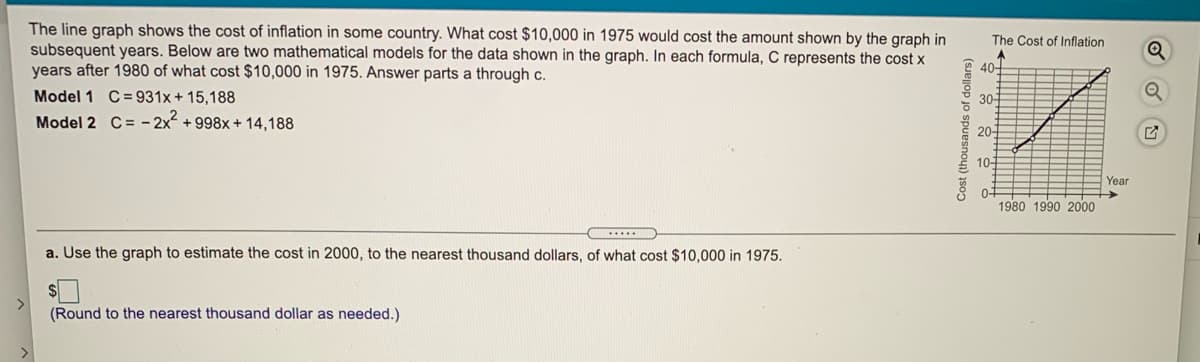
The line graph shows the cost of inflation in some country. What cost $10,000 in 1975 would cost the amount shown by the graph in subsequent years. Below are two mathematical models for the data shown in the graph. In each formula, C represents the cost x years after 1980 of what cost $10,000 in 1975. Answer parts a through c. The Cost of Inflation 40- Model 1 C=931x + 15,188 30- Model 2 C= - 2x +998x + 14,188 20- 10- Year 0- 1980 1990 2000 C ..... a. Use the graph to estimate the cost in 2000, to the nearest thousand dollars, of what cost $10,000 in 1975. > (Round to the nearest thousand dollar as needed.) (Ssejop jo spuesnoun) ison


Unitary Method
The word “unitary” comes from the word “unit”, which means a single and complete entity. In this method, we find the value of a unit product from the given number of products, and then we solve for the other number of products.
Speed, Time, and Distance
Imagine you and 3 of your friends are planning to go to the playground at 6 in the evening. Your house is one mile away from the playground and one of your friends named Jim must start at 5 pm to reach the playground by walk. The other two friends are 3 miles away.
Profit and Loss
The amount earned or lost on the sale of one or more items is referred to as the profit or loss on that item.
Units and Measurements
Measurements and comparisons are the foundation of science and engineering. We, therefore, need rules that tell us how things are measured and compared. For these measurements and comparisons, we perform certain experiments, and we will need the experiments to set up the devices.


Trending now
This is a popular solution!

Step by step
Solved in 2 steps


