The Marketing Manager of Dotcom Limited has conducted a market research on the price-demand relationship for its consumer durable Product-V which has been recently launched. The price-demand pattern will be as follows: Price per unit (Rs.) 16.650 16.050 14.400 13.050 Product-V is manufactured in batches of 1.000 units. The production manager of Dotcom Limited has also researched and studies the pattern and believes that 50% of the variable manufacturing cost would have a learning effect. This learning curve effect will continue up to 4.000 units of production at constant rate But after 4.000 units of production unit variable manufacturing cost would be equal to the unit cost at the 4 batch. The manufacturing unit cost of the first batch will be Rs. 6.600 of which only 50% is subjected to learning and experience curve effect. The average unit variable of all 4 batches will be Rs 6.180 The price and maximum contribution at which Dotcom Limited should sell Product-V is: ORs.14,400, Rs. 24,496,137 Rs.16.650, Rs.27,419.374 Demand (units) 1.000 2.000 3.000 4.000 ORs.16,050, Rs. 23,866,137 ORs.13,050, Rs. 26,579,374
The Marketing Manager of Dotcom Limited has conducted a market research on the price-demand relationship for its consumer durable Product-V which has been recently launched. The price-demand pattern will be as follows: Price per unit (Rs.) 16.650 16.050 14.400 13.050 Product-V is manufactured in batches of 1.000 units. The production manager of Dotcom Limited has also researched and studies the pattern and believes that 50% of the variable manufacturing cost would have a learning effect. This learning curve effect will continue up to 4.000 units of production at constant rate But after 4.000 units of production unit variable manufacturing cost would be equal to the unit cost at the 4 batch. The manufacturing unit cost of the first batch will be Rs. 6.600 of which only 50% is subjected to learning and experience curve effect. The average unit variable of all 4 batches will be Rs 6.180 The price and maximum contribution at which Dotcom Limited should sell Product-V is: ORs.14,400, Rs. 24,496,137 Rs.16.650, Rs.27,419.374 Demand (units) 1.000 2.000 3.000 4.000 ORs.16,050, Rs. 23,866,137 ORs.13,050, Rs. 26,579,374

Practical Management Science
6th Edition
ISBN:9781337406659
Author:WINSTON, Wayne L.
Publisher:WINSTON, Wayne L.
Chapter13: Regression And Forecasting Models
Section: Chapter Questions
Problem 34P: A small computer chip manufacturer wants to forecast monthly ozperating costs as a function of the...

Related questions
Question
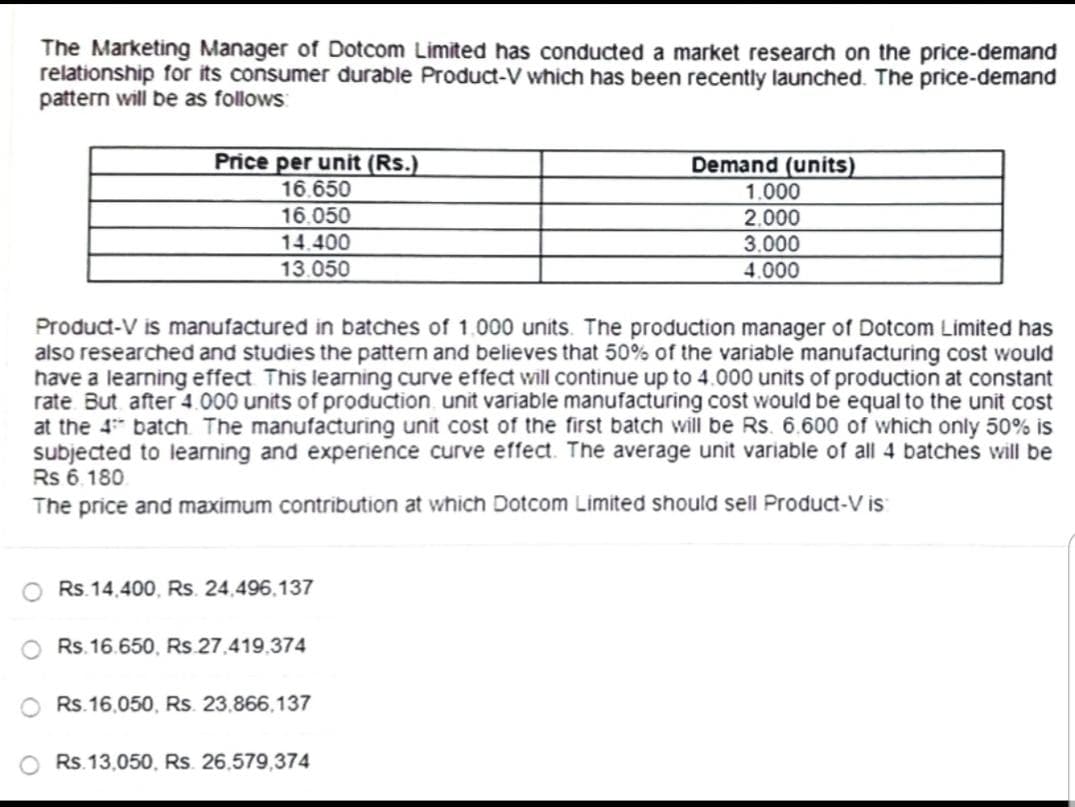
Transcribed Image Text:The Marketing Manager of Dotcom Limited has conducted a market research on the price-demand
relationship for its consumer durable Product-V which has been recently launched. The price-demand
pattern will be as follows:
Price per unit (Rs.)
16.650
16.050
14.400
13.050
Product-V is manufactured in batches of 1.000 units. The production manager of Dotcom Limited has
also researched and studies the pattern and believes that 50% of the variable manufacturing cost would
have a learning effect. This learning curve effect will continue up to 4.000 units of production at constant
rate But after 4.000 units of production unit variable manufacturing cost would be equal to the unit cost
at the 4 batch. The manufacturing unit cost of the first batch will be Rs. 6.600 of which only 50% is
subjected to learning and experience curve effect. The average unit variable of all 4 batches will be
Rs 6.180
The price and maximum contribution at which Dotcom Limited should sell Product-V is:
Rs.14,400, Rs. 24,496,137
Rs.16.650, Rs.27.419.374
Rs.16,050, Rs. 23,866,137
Demand (units)
1.000
2.000
3.000
4.000
Rs.13,050, Rs. 26,579,374
Expert Solution
This question has been solved!
Explore an expertly crafted, step-by-step solution for a thorough understanding of key concepts.

Step by step
Solved in 2 steps with 6 images

Recommended textbooks for you
Practical Management Science
Operations Management
ISBN:
9781337406659
Author:
WINSTON, Wayne L.
Publisher:
Cengage,
Practical Management Science
Operations Management
ISBN:
9781337406659
Author:
WINSTON, Wayne L.
Publisher:
Cengage,