The prices of a sample of books at University A were obtained by two statistics students. Then the cost of books for the same subjects (at the same level) were obtained for University B. Assume that the distribution of differences is Normal enough to proceed, and assume that the sampling was random. a. First find both sample means and compare them. b. Test the hypothesis that the population means are different, using a significance level of 0.05. E Click the icon to view the table of prices. a. Find the sample mean for University A. $ 64.60 (Round to the nearest cent as needed.) Find the sample mean for University B. $ 70.40 (Round to the nearest cent as needed.) Compare the sample means. The sample mean is larger at University B. b. Determine the hypotheses for this test. Let Pdiference be the mean of differences between the paired observations. Choose the correct answer below. O A. Ho: Haifference =0 B. Họ: Haifference > 0 Ha: Hdifference <0 Ha: Pdiference =0 Oc. Họ: Hdifference 0 O D. Họ: Hdifference <0 Ha: Hdifference =0 Ha: Hdifference =0 O E. Ho: Haifference =0 F. Ho: Hdifference =0 Ha: Hdifference >0 Ha: Hdifference #0 Find the test statistic for this test. t= (Round to two decimal places as needed.) Data table University A ($) University B ($) 75 82 82 90 80 77 48 58 40 53 72 52 74 48 69 77 66 87 52 72 51 59 70 75 65 70 82 84 61 54
The prices of a sample of books at University A were obtained by two statistics students. Then the cost of books for the same subjects (at the same level) were obtained for University B. Assume that the distribution of differences is Normal enough to proceed, and assume that the sampling was random. a. First find both sample means and compare them. b. Test the hypothesis that the population means are different, using a significance level of 0.05. E Click the icon to view the table of prices. a. Find the sample mean for University A. $ 64.60 (Round to the nearest cent as needed.) Find the sample mean for University B. $ 70.40 (Round to the nearest cent as needed.) Compare the sample means. The sample mean is larger at University B. b. Determine the hypotheses for this test. Let Pdiference be the mean of differences between the paired observations. Choose the correct answer below. O A. Ho: Haifference =0 B. Họ: Haifference > 0 Ha: Hdifference <0 Ha: Pdiference =0 Oc. Họ: Hdifference 0 O D. Họ: Hdifference <0 Ha: Hdifference =0 Ha: Hdifference =0 O E. Ho: Haifference =0 F. Ho: Hdifference =0 Ha: Hdifference >0 Ha: Hdifference #0 Find the test statistic for this test. t= (Round to two decimal places as needed.) Data table University A ($) University B ($) 75 82 82 90 80 77 48 58 40 53 72 52 74 48 69 77 66 87 52 72 51 59 70 75 65 70 82 84 61 54

Glencoe Algebra 1, Student Edition, 9780079039897, 0079039898, 2018
18th Edition
ISBN:9780079039897
Author:Carter
Publisher:Carter
Chapter10: Statistics
Section10.4: Distributions Of Data
Problem 19PFA

Related questions
Question
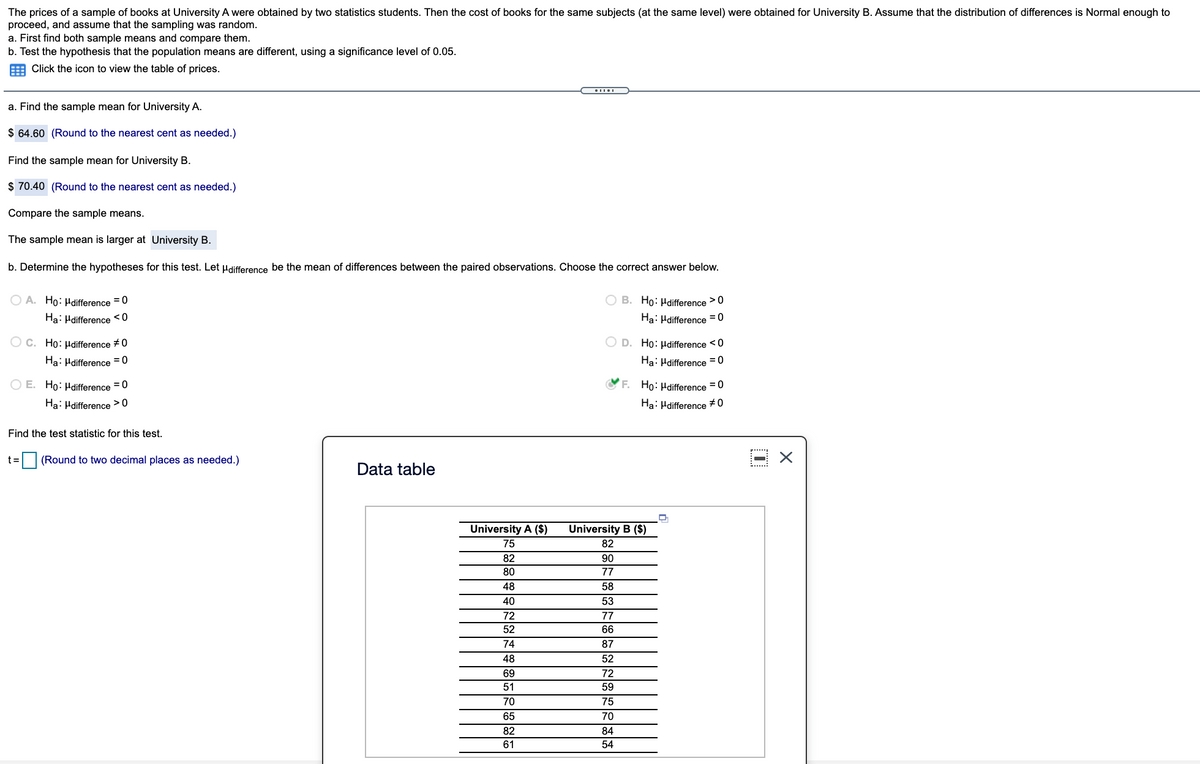
Transcribed Image Text:The prices of a sample of books at University A were obtained by two statistics students. Then the cost of books for the same subjects (at the same level) were obtained for University B. Assume that the distribution of differences is Normal enough to
proceed, and assume that the sampling was random.
a. First find both sample means and compare them.
b. Test the hypothesis that the population means are different, using a significance level of 0.05.
E Click the icon to view the table of prices.
a. Find the sample mean for University A.
$ 64.60 (Round to the nearest cent as needed.)
Find the sample mean for University B.
$ 70.40 (Round to the nearest cent as needed.)
Compare the sample means.
The sample mean is larger at University B.
b. Determine the hypotheses for this test. Let Hdifference be the mean of differences between the paired observations. Choose the correct answer below.
O A. Ho: Hdifference = 0
O B. Ho: Hdifference >0
Ha: Hdifference <0
Ha: Hdifference = 0
O c. Ho: µdifference #0
O D. Ho: Hdifference <0
Ha: Hdifference = 0
Ha: Hdifference = 0
O E. Ho: Hdifference =0
F. Ho: Hdifference =0
Ha: Hdifference >0
Ha: Hdifference +0
Find the test statistic for this test.
t =
(Round to two decimal places as needed.)
Data table
University A ($)
University B ($)
75
82
82
90
80
77
48
58
40
53
72
77
52
66
74
87
48
52
69
72
51
59
70
75
65
70
82
84
61
54
Expert Solution
This question has been solved!
Explore an expertly crafted, step-by-step solution for a thorough understanding of key concepts.

This is a popular solution!

Trending now
This is a popular solution!

Step by step
Solved in 2 steps with 1 images

Recommended textbooks for you
Glencoe Algebra 1, Student Edition, 9780079039897…
Algebra
ISBN:
9780079039897
Author:
Carter
Publisher:
McGraw Hill
Glencoe Algebra 1, Student Edition, 9780079039897…
Algebra
ISBN:
9780079039897
Author:
Carter
Publisher:
McGraw Hill