The table below shows the total annual precipitation for San Diego, California. 2001 0 2001 2002 2003 2002 2003 4.2 9.2 1994 1995 1996 1997 1998 1999 2000 Precip. (in.) 9.4 17.0 7.3 7.0 16.1 5.4 6.9 8.5 Year The standard deviation is mean. ◆ There are ♦ years where the rainfall was more than one standard deviation from the
The table below shows the total annual precipitation for San Diego, California. 2001 0 2001 2002 2003 2002 2003 4.2 9.2 1994 1995 1996 1997 1998 1999 2000 Precip. (in.) 9.4 17.0 7.3 7.0 16.1 5.4 6.9 8.5 Year The standard deviation is mean. ◆ There are ♦ years where the rainfall was more than one standard deviation from the

Glencoe Algebra 1, Student Edition, 9780079039897, 0079039898, 2018
18th Edition
ISBN:9780079039897
Author:Carter
Publisher:Carter
Chapter10: Statistics
Section10.3: Measures Of Spread
Problem 26PFA

Related questions
Question
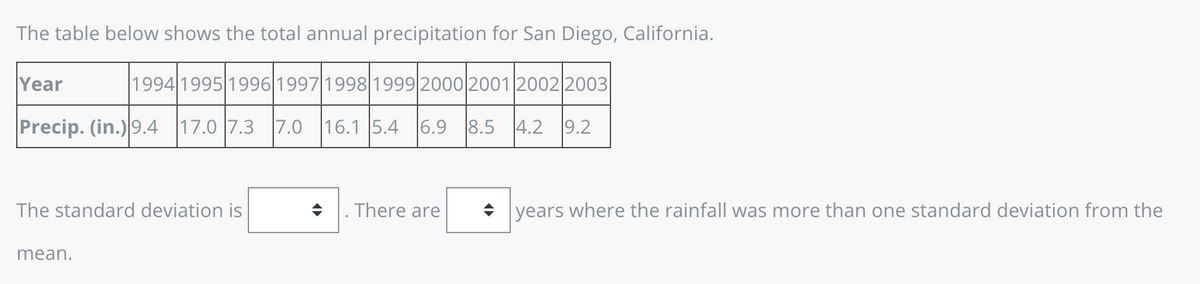
Transcribed Image Text:The table below shows the total annual precipitation for San Diego, California.
Year
1994 1995 1996 1997 1998 1999 2000 2001 2002 2003
Precip. (in.) 9.4 17.0 7.3 7.0 16.1 5.4 6.9 8.5 4.2 9.2
The standard deviation is
mean.
. There are
◆ years where the rainfall was more than one standard deviation from the
Expert Solution
This question has been solved!
Explore an expertly crafted, step-by-step solution for a thorough understanding of key concepts.

This is a popular solution!

Trending now
This is a popular solution!

Step by step
Solved in 3 steps

Recommended textbooks for you
Glencoe Algebra 1, Student Edition, 9780079039897…
Algebra
ISBN:
9780079039897
Author:
Carter
Publisher:
McGraw Hill
Glencoe Algebra 1, Student Edition, 9780079039897…
Algebra
ISBN:
9780079039897
Author:
Carter
Publisher:
McGraw Hill