The table contains the state population and the number of licensed drivers in the state (both in millions) for the states with population under 1 million in 2014. The regression model for this data is y= 0.75x where x is the state population (in millions) and y is the number of licensed drivers (in millions) in the state. Licensed Drivers in 2014 TTT State Population Licensed Drivers A 0.71 0.53 B 0.94 0.71 0.96 0.72 0.74 0.55 0.84 0.64 F 0.62 0.47 0.58 0.44 (A) Draw a scatter plot of the data and a graph of the model on the same axes. Choose the correct graph below. A. O B. Oc. OD. 0.5 0.5 0.5- 0.5 0- 0.7 1.4 0.7 1.4 0.7 1.4 0.7 1.4 State pop. (millions, x) State pop. (millions, x) State pop. (millions, x) State pop. (millions, x] (B) If the population of state H in 2014 was about 1.6 million, use the model to estimate the number of licensed drivers in state H in 2014. The estimated number of licensed drivers in state H in 2014 is. (Type a whole number. Round to the nearest thousand as needed.) Drivers (millions, y)
The table contains the state population and the number of licensed drivers in the state (both in millions) for the states with population under 1 million in 2014. The regression model for this data is y= 0.75x where x is the state population (in millions) and y is the number of licensed drivers (in millions) in the state. Licensed Drivers in 2014 TTT State Population Licensed Drivers A 0.71 0.53 B 0.94 0.71 0.96 0.72 0.74 0.55 0.84 0.64 F 0.62 0.47 0.58 0.44 (A) Draw a scatter plot of the data and a graph of the model on the same axes. Choose the correct graph below. A. O B. Oc. OD. 0.5 0.5 0.5- 0.5 0- 0.7 1.4 0.7 1.4 0.7 1.4 0.7 1.4 State pop. (millions, x) State pop. (millions, x) State pop. (millions, x) State pop. (millions, x] (B) If the population of state H in 2014 was about 1.6 million, use the model to estimate the number of licensed drivers in state H in 2014. The estimated number of licensed drivers in state H in 2014 is. (Type a whole number. Round to the nearest thousand as needed.) Drivers (millions, y)

Linear Algebra: A Modern Introduction
4th Edition
ISBN:9781285463247
Author:David Poole
Publisher:David Poole
Chapter7: Distance And Approximation
Section7.3: Least Squares Approximation
Problem 31EQ

Related questions
Question
7B Please answer B)
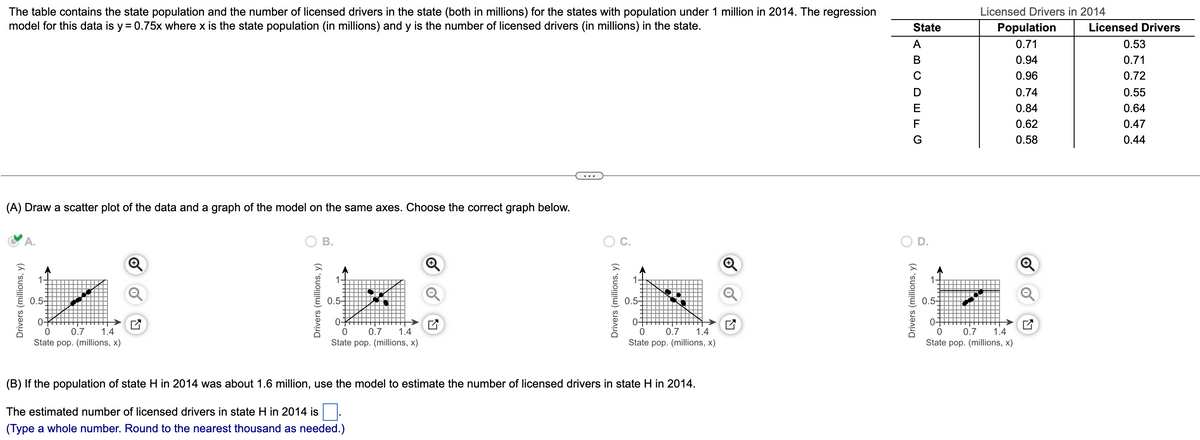
Transcribed Image Text:The table contains the state population and the number of licensed drivers in the state (both in millions) for the states with population under 1 million in 2014. The regression
model for this data is y = 0.75x where x is the state population (in millions) and y is the number of licensed drivers (in millions) in the state.
Licensed Drivers in 2014
State
Population
Licensed Drivers
A
0.71
0.53
В
0.94
0.71
C
0.96
0.72
0.74
0.55
E
0.84
0.64
F
0.62
0.47
G
0.58
0.44
(A) Draw a scatter plot of the data and a graph of the model on the same axes. Choose the correct graph below.
В.
O C.
O D.
0.5-
0.5-
0.5-
0.5-
0-
0-
0-
0-
0.7
1.4
0.7
1.4
0.7
1.4
0.7
1.4
State pop. (millions, x)
State pop. (millions, x)
State pop. (millions, x)
State pop. (millions, x)
(B) If the population
state H in 2014 was ab
million, use the model
estimate the number of licensed drivers
state
2014.
The estimated number of licensed drivers in state H in 2014 is
(Type a whole number. Round to the nearest thousand as needed.)
Drivers (millions, y)
Drivers (millions, y)
Drivers (millions, y)
Drivers (millions, y)
Expert Solution
This question has been solved!
Explore an expertly crafted, step-by-step solution for a thorough understanding of key concepts.

This is a popular solution!

Trending now
This is a popular solution!

Step by step
Solved in 2 steps with 1 images

Follow-up Questions
Read through expert solutions to related follow-up questions below.
Follow-up Question
7C

Transcribed Image Text:The table contains the state population and the number of
licensed drivers in the state (both in millions) for the states
with population under 1 million in 2014. The regression model
for this data is y = 0.75x where x is the state population (in
millions) and y is the number of licensed drivers (in millions) in
Licensed Drivers in 2014
State
Population
Licensed Drivers
A
0.71
0.53
В
0.94
0.71
C
0.96
0.72
the state.
0.74
0.55
E
0.84
0.64
F
0.62
0.47
G
0.58
0.44
0.7
1.4
0.7
1.4
0.7
1.4
0.7
1.4
State pop. (millions, x)
State pop. (millions, x)
State pop. (millions, x)
State pop. (millions, x)
(B) If the population of state H in 2014 was about 1.6 million, use the model to estimate the number of licensed drivers in
state H in 2014.
The estimated number of licensed drivers in state H in 2014 is 1,200,000`.
(Type a whole number. Round to the nearest thousand as needed.)
(C) If the number of licensed drivers in state J in 2014 was about 1,037,000, use the model to estimate the population of
state J in 2014.
The estimated population of state J in 2014 is.
(Type a whole number. Round to the nearest thousand as needed.)
The table oontains the populaton and heumter of
kel vesin e
Drivers
Drivers
Drivers
Drivers
Solution
Recommended textbooks for you
Linear Algebra: A Modern Introduction
Algebra
ISBN:
9781285463247
Author:
David Poole
Publisher:
Cengage Learning

Functions and Change: A Modeling Approach to Coll…
Algebra
ISBN:
9781337111348
Author:
Bruce Crauder, Benny Evans, Alan Noell
Publisher:
Cengage Learning

Glencoe Algebra 1, Student Edition, 9780079039897…
Algebra
ISBN:
9780079039897
Author:
Carter
Publisher:
McGraw Hill
Linear Algebra: A Modern Introduction
Algebra
ISBN:
9781285463247
Author:
David Poole
Publisher:
Cengage Learning
Functions and Change: A Modeling Approach to Coll…
Algebra
ISBN:
9781337111348
Author:
Bruce Crauder, Benny Evans, Alan Noell
Publisher:
Cengage Learning
Glencoe Algebra 1, Student Edition, 9780079039897…
Algebra
ISBN:
9780079039897
Author:
Carter
Publisher:
McGraw Hill