The University of Cincinnati Center for Business Analytics is an outreach center that collaborates with industry partners on applied research and continuing education in business analytics. One of the programs offered by the center is a quarterly Business Intelligence Symposium. Each symposium features three speakers on the real-world use of analytics. Each corporate member of the center (there are currently 10) receives seven free seats to each symposium. Nonmembers wishing to attend must pay $75 per person. Each attendee receives breakfast, lunch, and free parking. The following are the costs incurred for putting on this event: Rental cost for the auditorium: Registration Processing: Speaker Costs: Continental Breakfast: Lunch: Parking: $150 $8.50 per person 3@$800 = $2,400 $4.00 per person $7.00 per person $5.00 per person (a) The Center for Business Analytics is considering a refund policy for no-shows. No refund would be given for members who do not attend, but nonmembers who do not attend will be refunded 50% of the price. Build a spreadsheet model that calculates a profit or loss based on the number of nonmember registrants. Account for the fact that, historically, 25% of members who registered do not show and 10% of registered nonmembers do not attend. The center pays the caterer for breakfast and lunch based on the number of registrants (not the number of attendees). However, the center only pays for parking for those who attend. What is the profit if each corporate member registers their full allotment of tickets and 127 nonmembers register? If required, round your answers to two decimal places. $ (b) Use a two-way data table to show how profit changes as a function of number of registered nonmembers and the no-show percentage of nonmembers. Vary number of nonmember registrants from 80 to 160 in increments of 5 and the percentage of nonmember no-shows from 10% to 30% in increments of 2%. In which interval of nonmember registrants does breakeven occur if the percentage of nonmember no-shows is 22%? Breakeven appears in the interval of (c) Consider three scenarios: to registered nonmembers. % of Members Who Do Not Show % of Nonmembers Who Do Not Show Number of Nonmember Registrants Base Case Worst Case Best Case 25% 10% 137 50% 30% 105 20% 4% 185 All other inputs are the same as in part (a). Use Scenario Manager to generate a summary report that gives the profit for each of these three scenarios. What is the highest profit? What is the lowest profit? If required, round your answers to two decimal places. For subtractive or negative numbers use a minus sign. The highest profit is $ The lowest profit is $
The University of Cincinnati Center for Business Analytics is an outreach center that collaborates with industry partners on applied research and continuing education in business analytics. One of the programs offered by the center is a quarterly Business Intelligence Symposium. Each symposium features three speakers on the real-world use of analytics. Each corporate member of the center (there are currently 10) receives seven free seats to each symposium. Nonmembers wishing to attend must pay $75 per person. Each attendee receives breakfast, lunch, and free parking. The following are the costs incurred for putting on this event: Rental cost for the auditorium: Registration Processing: Speaker Costs: Continental Breakfast: Lunch: Parking: $150 $8.50 per person 3@$800 = $2,400 $4.00 per person $7.00 per person $5.00 per person (a) The Center for Business Analytics is considering a refund policy for no-shows. No refund would be given for members who do not attend, but nonmembers who do not attend will be refunded 50% of the price. Build a spreadsheet model that calculates a profit or loss based on the number of nonmember registrants. Account for the fact that, historically, 25% of members who registered do not show and 10% of registered nonmembers do not attend. The center pays the caterer for breakfast and lunch based on the number of registrants (not the number of attendees). However, the center only pays for parking for those who attend. What is the profit if each corporate member registers their full allotment of tickets and 127 nonmembers register? If required, round your answers to two decimal places. $ (b) Use a two-way data table to show how profit changes as a function of number of registered nonmembers and the no-show percentage of nonmembers. Vary number of nonmember registrants from 80 to 160 in increments of 5 and the percentage of nonmember no-shows from 10% to 30% in increments of 2%. In which interval of nonmember registrants does breakeven occur if the percentage of nonmember no-shows is 22%? Breakeven appears in the interval of (c) Consider three scenarios: to registered nonmembers. % of Members Who Do Not Show % of Nonmembers Who Do Not Show Number of Nonmember Registrants Base Case Worst Case Best Case 25% 10% 137 50% 30% 105 20% 4% 185 All other inputs are the same as in part (a). Use Scenario Manager to generate a summary report that gives the profit for each of these three scenarios. What is the highest profit? What is the lowest profit? If required, round your answers to two decimal places. For subtractive or negative numbers use a minus sign. The highest profit is $ The lowest profit is $

Practical Management Science
6th Edition
ISBN:9781337406659
Author:WINSTON, Wayne L.
Publisher:WINSTON, Wayne L.
Chapter4: Linear Programming Models
Section: Chapter Questions
Problem 107P

Related questions
Question
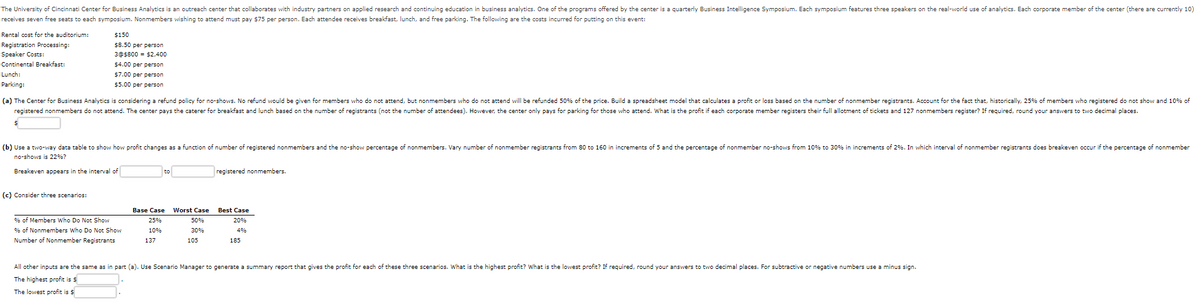
Transcribed Image Text:The University of Cincinnati Center for Business Analytics is an outreach center that collaborates with industry partners on applied research and continuing education in business analytics. One of the programs offered by the center is a quarterly Business Intelligence Symposium. Each symposium features three speakers on the real-world use of analytics. Each corporate member of the center (there are currently 10)
receives seven free seats to each symposium. Nonmembers wishing to attend must pay $75 per person. Each attendee receives breakfast, lunch, and free parking. The following are the costs incurred for putting on this event:
Rental cost for the auditorium:
Registration Processing:
Speaker Costs:
Continental Breakfast:
Lunch:
Parking:
$150
$8.50 per person
3@$800 = $2,400
$4.00 per person
$7.00 per person
$5.00 per person
(a) The Center for Business Analytics is considering a refund policy for no-shows. No refund would be given for members who do not attend, but nonmembers who do not attend will be refunded 50% of the price. Build a spreadsheet model that calculates a profit or loss based on the number of nonmember registrants. Account for the fact that, historically, 25% of members who registered do not show and 10% of
registered nonmembers do not attend. The center pays the caterer for breakfast and lunch based on the number of registrants (not the number of attendees). However, the center only pays for parking for those who attend. What is the profit if each corporate member registers their full allotment of tickets and 127 nonmembers register? If required, round your answers to two decimal places.
$
(b) Use a two-way data table to show how profit changes as a function of number of registered nonmembers and the no-show percentage of nonmembers. Vary number of nonmember registrants from 80 to 160 in increments of 5 and the percentage of nonmember no-shows from 10% to 30% in increments of 2%. In which interval of nonmember registrants does breakeven occur if the percentage of nonmember
no-shows is 22%?
Breakeven appears in the interval of
(c) Consider three scenarios:
to
registered nonmembers.
% of Members Who Do Not Show
% of Nonmembers Who Do Not Show
Number of Nonmember Registrants
Base Case Worst Case
Best Case
25%
10%
137
50%
30%
105
20%
4%
185
All other inputs are the same as in part (a). Use Scenario Manager to generate a summary report that gives the profit for each of these three scenarios. What is the highest profit? What is the lowest profit? If required, round your answers to two decimal places. For subtractive or negative numbers use a minus sign.
The highest profit is $
The lowest profit is $
Expert Solution
This question has been solved!
Explore an expertly crafted, step-by-step solution for a thorough understanding of key concepts.

This is a popular solution!

Trending now
This is a popular solution!

Step by step
Solved in 2 steps

Recommended textbooks for you
Practical Management Science
Operations Management
ISBN:
9781337406659
Author:
WINSTON, Wayne L.
Publisher:
Cengage,
Practical Management Science
Operations Management
ISBN:
9781337406659
Author:
WINSTON, Wayne L.
Publisher:
Cengage,