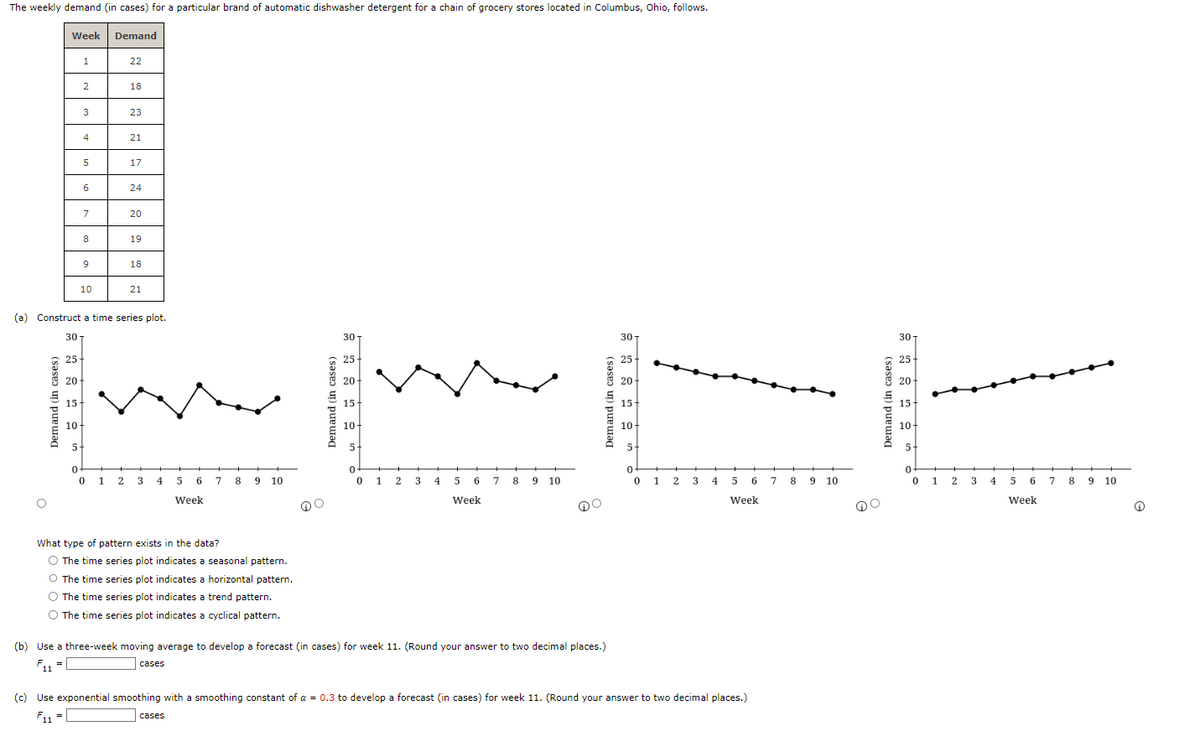
The weekly demand (in cases) for a particular brand of automatic dishwasher detergent for a chain of grocery stores located in Columbus, Ohio, follows. Week Demand O 1 2 3 4 5 30- 6 7 8 9 10 25+ 20 15- 10+ 5+ 0+ 22 0 18 23 21 17 24 20 (a) Construct a time series plot. 19 18 21 1 2 3 4 5 6 7 8 Week What type of pattern exists in the data? O The time series plot indicates a seasonal pattern. O The time series plot indicates a horizontal pattern. O The time series plot indicates a trend pattern. The time series plot indicates a cyclical pattern. cases 9 10 cases 30 T 25 20 15- 10+ 5+ 0 0 1 2 3 4 5 6 7 8 9 10 Week (b) Use a three-week moving average to develop a forecast (in cases) for week 11. (Round your answer to two decimal places.) O 30 25 20 15- 10+ 5+ 0 0 1 2 3 4 5 6 7 8 9 10 Week (c) Use exponential smoothing with a smoothing constant of a 0.3 to develop a forecast (in cases) for week 11. (Round your answer to two decimal places.) 20- F 15- 10+ 0- 01 23 4 5 30T 25+ 5- 6 7 8 9 10 Week
The weekly demand (in cases) for a particular brand of automatic dishwasher detergent for a chain of grocery stores located in Columbus, Ohio, follows. Week Demand O 1 2 3 4 5 30- 6 7 8 9 10 25+ 20 15- 10+ 5+ 0+ 22 0 18 23 21 17 24 20 (a) Construct a time series plot. 19 18 21 1 2 3 4 5 6 7 8 Week What type of pattern exists in the data? O The time series plot indicates a seasonal pattern. O The time series plot indicates a horizontal pattern. O The time series plot indicates a trend pattern. The time series plot indicates a cyclical pattern. cases 9 10 cases 30 T 25 20 15- 10+ 5+ 0 0 1 2 3 4 5 6 7 8 9 10 Week (b) Use a three-week moving average to develop a forecast (in cases) for week 11. (Round your answer to two decimal places.) O 30 25 20 15- 10+ 5+ 0 0 1 2 3 4 5 6 7 8 9 10 Week (c) Use exponential smoothing with a smoothing constant of a 0.3 to develop a forecast (in cases) for week 11. (Round your answer to two decimal places.) 20- F 15- 10+ 0- 01 23 4 5 30T 25+ 5- 6 7 8 9 10 Week

MATLAB: An Introduction with Applications
6th Edition
ISBN:9781119256830
Author:Amos Gilat
Publisher:Amos Gilat
Chapter1: Starting With Matlab
Section: Chapter Questions
Problem 1P

Related questions
Question
100%
Transcribed Image Text:The weekly demand (in cases) for a particular brand of automatic dishwasher detergent for a chain of grocery stores located in Columbus, Ohio, follows.
O
Week
Demand (in cases)
30
25
20
15
1
0
2
3
10-
5
4
5
6
7
8
9
10
Demand
22
0 1 2
18
23
(a) Construct a time series plot.
21
17
24
20
8
19
18
21
3 4 5
6
Week
What type of pattern exists in the data?
cases
7 8 9 10
The time series plot indicates a seasonal pattern.
O The time series plot indicates a horizontal pattern.
O The time series plot indicates a trend pattern.
O The time series plot indicates a cyclical pattern.
cases
30-
25
20
15+
10-
5
0 +
0 1 2 3 4
5
Week
6
7
8
(b) Use a three-week moving average to develop a forecast (in cases) for week 11. (Round your answer to two decimal places.)
F11 =
9 10
30
25
20+
15
10+
5+
0
+
0 1 2
3 4 5 6
6 7 8 9 10
Week
(c) Use exponential smoothing with a smoothing constant of a = 0.3 to develop a forecast (in cases) for week 11. (Round your answer to two decimal places.)
F11 =
Demand (in cases)
301
25
20
15-
10+
5+
0
+
01
2
3 4 5 6 7 8 9 10
Week
Ⓡ
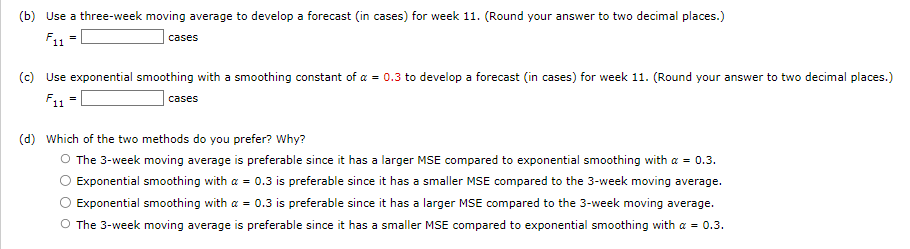
Transcribed Image Text:(b) Use a three-week moving average to develop a forecast (in cases) for week 11. (Round your answer to two decimal places.)
F11
=
cases
(c) Use exponential smoothing with a smoothing constant of a = 0.3 to develop a forecast (in cases) for week 11. (Round your answer to two decimal places.)
F11
cases
=
(d) Which of the two methods do you prefer? Why?
O The 3-week moving average is preferable since it has a larger MSE compared to exponential smoothing with a = 0.3.
Exponential smoothing with a = 0.3 is preferable since it has a smaller MSE compared to the 3-week moving average.
Exponential smoothing with a = 0.3 is preferable since it has a larger MSE compared to the 3-week moving average.
O The 3-week moving average is preferable since it has a smaller MSE compared to exponential smoothing with a = 0.3.
Expert Solution
This question has been solved!
Explore an expertly crafted, step-by-step solution for a thorough understanding of key concepts.

Step by step
Solved in 5 steps with 1 images

Recommended textbooks for you
MATLAB: An Introduction with Applications
Statistics
ISBN:
9781119256830
Author:
Amos Gilat
Publisher:
John Wiley & Sons Inc

Probability and Statistics for Engineering and th…
Statistics
ISBN:
9781305251809
Author:
Jay L. Devore
Publisher:
Cengage Learning

Statistics for The Behavioral Sciences (MindTap C…
Statistics
ISBN:
9781305504912
Author:
Frederick J Gravetter, Larry B. Wallnau
Publisher:
Cengage Learning
MATLAB: An Introduction with Applications
Statistics
ISBN:
9781119256830
Author:
Amos Gilat
Publisher:
John Wiley & Sons Inc
Probability and Statistics for Engineering and th…
Statistics
ISBN:
9781305251809
Author:
Jay L. Devore
Publisher:
Cengage Learning
Statistics for The Behavioral Sciences (MindTap C…
Statistics
ISBN:
9781305504912
Author:
Frederick J Gravetter, Larry B. Wallnau
Publisher:
Cengage Learning

Elementary Statistics: Picturing the World (7th E…
Statistics
ISBN:
9780134683416
Author:
Ron Larson, Betsy Farber
Publisher:
PEARSON

The Basic Practice of Statistics
Statistics
ISBN:
9781319042578
Author:
David S. Moore, William I. Notz, Michael A. Fligner
Publisher:
W. H. Freeman

Introduction to the Practice of Statistics
Statistics
ISBN:
9781319013387
Author:
David S. Moore, George P. McCabe, Bruce A. Craig
Publisher:
W. H. Freeman