The y-intercept and slope coefficient of the x-variable are 0.013 and .892, respectively. If the benchmark return is 14%, the regression model will estimate the portfolio return closest to
The y-intercept and slope coefficient of the x-variable are 0.013 and .892, respectively. If the benchmark return is 14%, the regression model will estimate the portfolio return closest to

Linear Algebra: A Modern Introduction
4th Edition
ISBN:9781285463247
Author:David Poole
Publisher:David Poole
Chapter4: Eigenvalues And Eigenvectors
Section4.6: Applications And The Perron-frobenius Theorem
Problem 22EQ

Related questions
Question
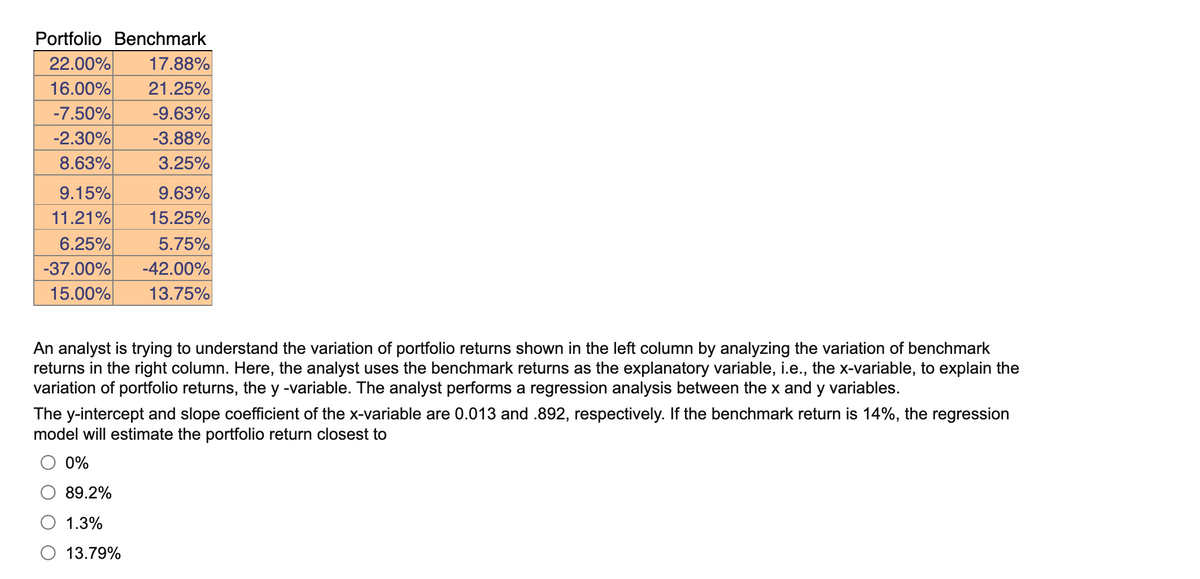
Transcribed Image Text:Portfolio Benchmark
22.00%
16.00%
-7.50%
-2.30%
8.63%
17.88%
21.25%
-9.63%
-3.88%
3.25%
9.15%
11.21%
9.63%
15.25%
6.25%
-37.00%
15.00%
5.75%
-42.00%
13.75%
An analyst is trying to understand the variation of portfolio returns shown in the left column by analyzing the variation of benchmark
returns in the right column. Here, the analyst uses the benchmark returns as the explanatory variable, i.e., the x-variable, to explain the
variation of portfolio returns, the y -variable. The analyst performs a regression analysis between the x and y variables.
The y-intercept and slope coefficient of the x-variable are 0.013 and .892, respectively. If the benchmark return is 14%, the regression
model will estimate the portfolio return closest to
O 0%
89.2%
1.3%
O 13.79%
Expert Solution
This question has been solved!
Explore an expertly crafted, step-by-step solution for a thorough understanding of key concepts.

This is a popular solution!

Trending now
This is a popular solution!

Step by step
Solved in 2 steps with 2 images

Recommended textbooks for you
Linear Algebra: A Modern Introduction
Algebra
ISBN:
9781285463247
Author:
David Poole
Publisher:
Cengage Learning
Linear Algebra: A Modern Introduction
Algebra
ISBN:
9781285463247
Author:
David Poole
Publisher:
Cengage Learning