uestion F and G question F) construct a fourfold table of the illness (diarrhea) by exposure to menu A. question G) calculate the odds ratio for diarrheal disease among those who were exposed to menu A compared to those who were exposed to other m
uestion F and G question F) construct a fourfold table of the illness (diarrhea) by exposure to menu A. question G) calculate the odds ratio for diarrheal disease among those who were exposed to menu A compared to those who were exposed to other m

MATLAB: An Introduction with Applications
6th Edition
ISBN:9781119256830
Author:Amos Gilat
Publisher:Amos Gilat
Chapter1: Starting With Matlab
Section: Chapter Questions
Problem 1P

Related questions
Question
100%
Answer question F and G
question F) construct a fourfold table of the illness (diarrhea) by exposure to menu A.
question G) calculate the odds ratio for diarrheal disease among those who were exposed to menu A compared to those who were exposed to other menus.
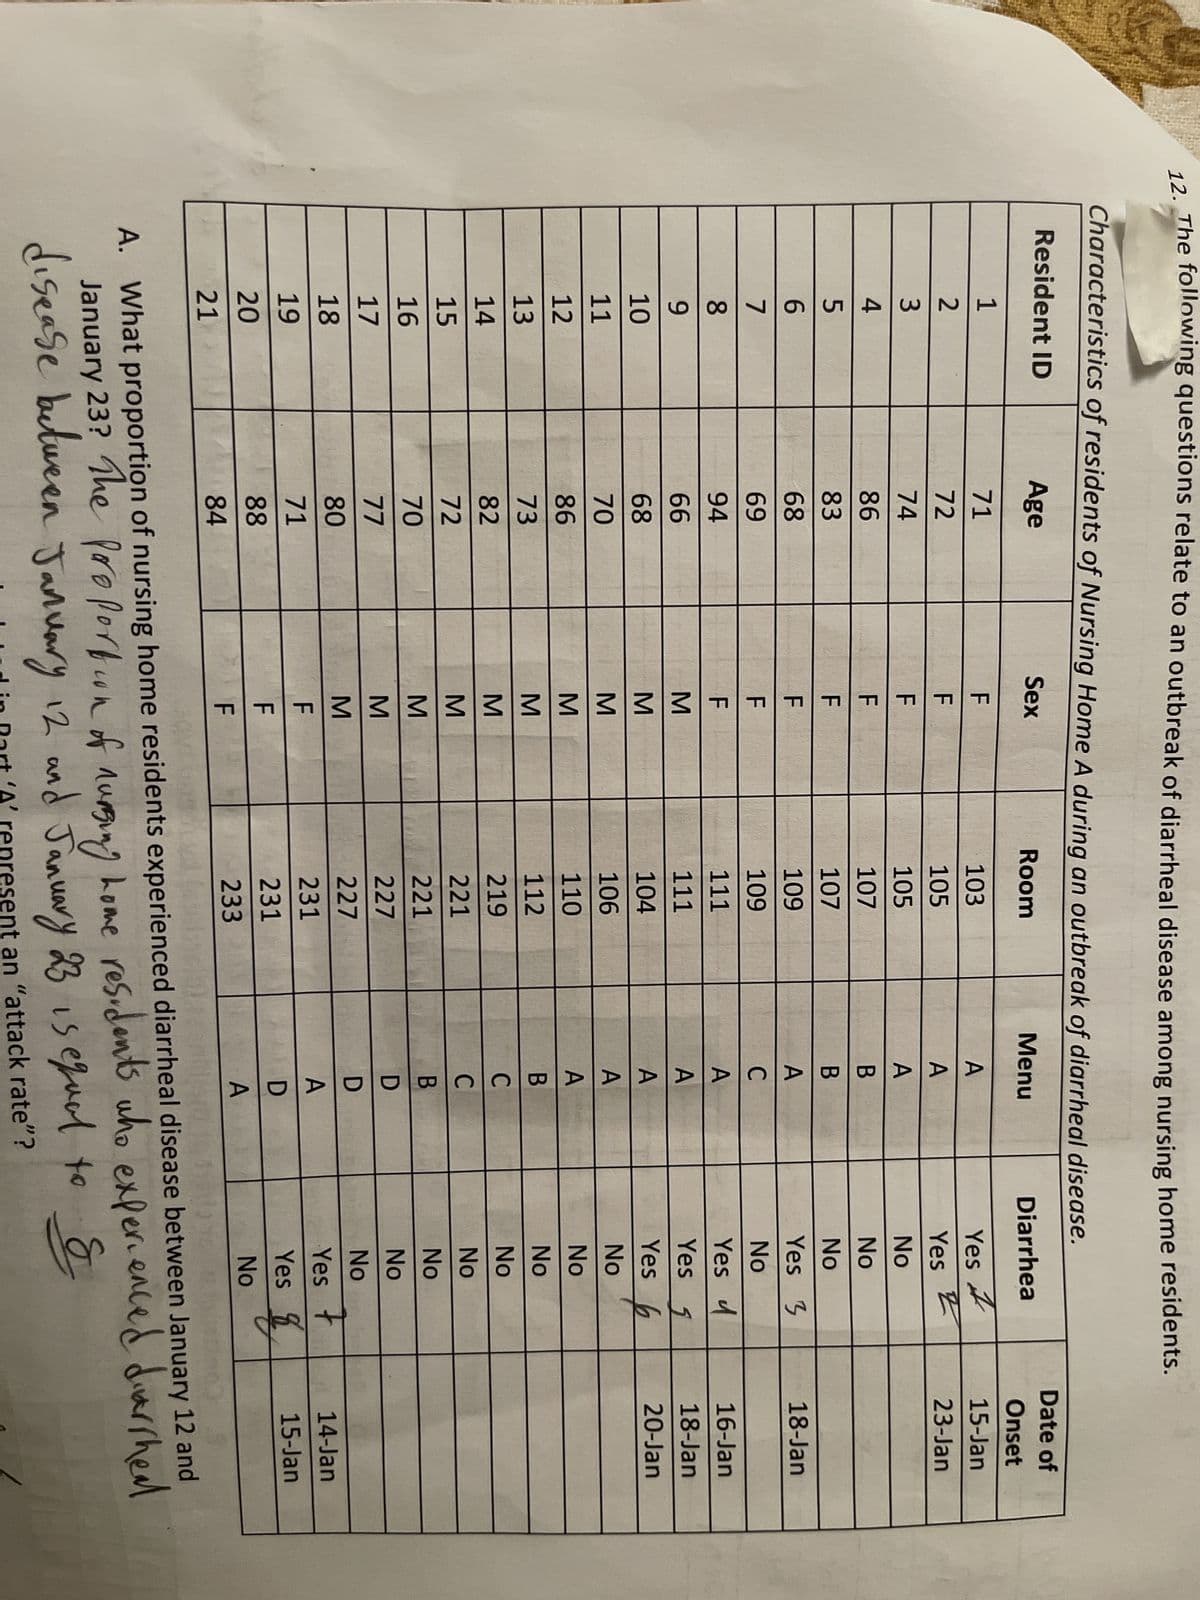
Transcribed Image Text:12. The following questions relate to an outbreak of diarrheal disease among nursing home residents.
Characteristics of residents of Nursing Home A during an outbreak of diarrheal disease.
Resident ID
Age
Sex
Room
Menu
71
F
A
72
F
A
74
A
86
B
83
B
68
A
69
C
94
A
66
A
68
A
A
70
A
86
B
73
C
82
C
72
B
70
D
77
D
80
A
71
D
88
A
84
1
234567
8
9
10
11
12
13
14
15
16
17
18
19
20
21
κκ.κκκκ ΣΣΣΣΣΣΣΣΣΣ 11
F
103
105
105
107
107
109
109
111
111
104
106
110
112
219
221
221
227
227
231
231
233
Diarrhea
Yes
Yes
No
No
No
Yes 3
No
Yes 4
Yes 5
Yes
No
No
No
2222
No
No
No
Z
No
þ
No
Yes 7
Yes
q
No
Date of
Onset
15-Jan
23-Jan
18-Jan
16-Jan
18-Jan
20-Jan
14-Jan
15-Jan
A. What proportion of nursing home residents experienced diarrheal disease between January 12 and
January 23? The proportion of nursing home residents who experienced diarrheal
disease between January 12 and January 23 is equal to I
in Part 'A' represent an "attack rate"?
262
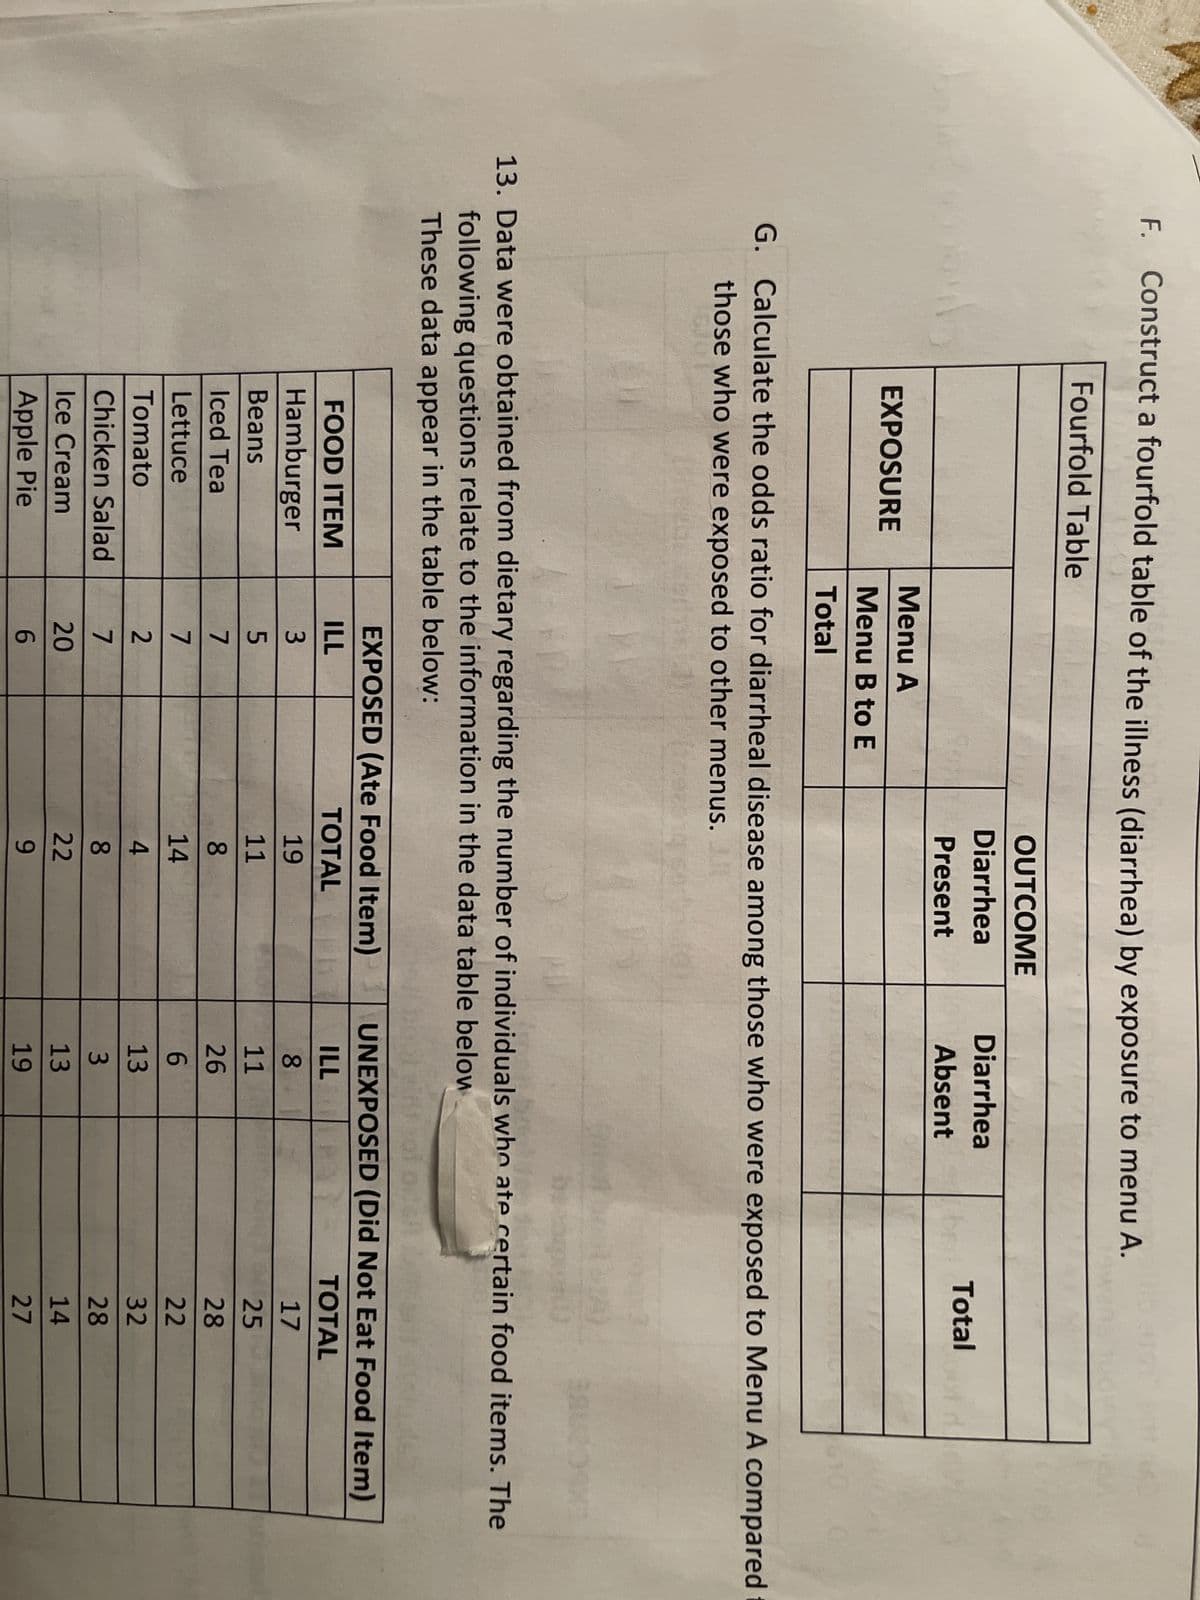
Transcribed Image Text:F. Construct a fourfold table of the illness (diarrhea) by exposure to menu A.
Fourfold Table
EXPOSURE
FOOD ITEM
Hamburger
Beans
Iced Tea
Menu A
Menu B to E
Total
Lettuce
Tomato
Chicken Salad
Ice Cream
Apple Pie
G. Calculate the odds ratio for diarrheal disease among those who were exposed to Menu A compared
those who were exposed to other menus.
161
13. Data were obtained from dietary regarding the number of individuals who ate certain food items. The
following questions relate to the information in the data table below
These data appear in the table below:
EXPOSED (Ate Food Item)
TOTAL
19
11
8
14
4
8
22
9
ILL
MENINA
3
5
7
7
OUTCOME
Diarrhea
Present
2
7
Diarrhea
Absent
20
6
Total
1
3.0
ILL
8
11
26
6
13
3
13
19
UNEXPOSED (Did Not Eat Food Item)
TOTAL
17
25
28
22
32
28
14
27
Expert Solution
This question has been solved!
Explore an expertly crafted, step-by-step solution for a thorough understanding of key concepts.

This is a popular solution!

Trending now
This is a popular solution!

Step by step
Solved in 2 steps

Recommended textbooks for you
MATLAB: An Introduction with Applications
Statistics
ISBN:
9781119256830
Author:
Amos Gilat
Publisher:
John Wiley & Sons Inc

Probability and Statistics for Engineering and th…
Statistics
ISBN:
9781305251809
Author:
Jay L. Devore
Publisher:
Cengage Learning

Statistics for The Behavioral Sciences (MindTap C…
Statistics
ISBN:
9781305504912
Author:
Frederick J Gravetter, Larry B. Wallnau
Publisher:
Cengage Learning
MATLAB: An Introduction with Applications
Statistics
ISBN:
9781119256830
Author:
Amos Gilat
Publisher:
John Wiley & Sons Inc
Probability and Statistics for Engineering and th…
Statistics
ISBN:
9781305251809
Author:
Jay L. Devore
Publisher:
Cengage Learning
Statistics for The Behavioral Sciences (MindTap C…
Statistics
ISBN:
9781305504912
Author:
Frederick J Gravetter, Larry B. Wallnau
Publisher:
Cengage Learning

Elementary Statistics: Picturing the World (7th E…
Statistics
ISBN:
9780134683416
Author:
Ron Larson, Betsy Farber
Publisher:
PEARSON

The Basic Practice of Statistics
Statistics
ISBN:
9781319042578
Author:
David S. Moore, William I. Notz, Michael A. Fligner
Publisher:
W. H. Freeman

Introduction to the Practice of Statistics
Statistics
ISBN:
9781319013387
Author:
David S. Moore, George P. McCabe, Bruce A. Craig
Publisher:
W. H. Freeman