
A First Course in Probability (10th Edition)
10th Edition
ISBN: 9780134753119
Author: Sheldon Ross
Publisher: PEARSON
expand_more
expand_more
format_list_bulleted
Related questions
Question
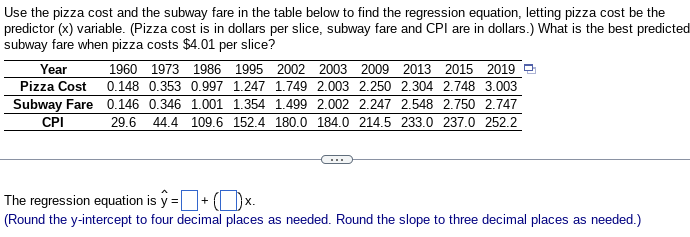

Transcribed Image Text:Use the pizza cost and the subway fare in the table below to find the regression equation, letting pizza cost be the
predictor (x) variable. (Pizza cost is in dollars per slice, subway fare and CPI are in dollars.) What is the best predicted
subway fare when pizza costs $4.01 per slice?
Year
Pizza Cost
Subway Fare
CPI
1960 1973 1986 1995 2002 2003 2009 2013 2015 2019
0.148 0.353 0.997 1.247 1.749 2.003 2.250 2.304 2.748 3.003
0.146 0.346 1.001 1.354 1.499 2.002 2.247 2.548 2.750 2.747
29.6 44.4 109.6 152.4 180.0 184.0 214.5 233.0 237.0 252.2
The regression equation is ŷ = + (x.
(Round the y-intercept to four decimal places as needed. Round the slope to three decimal places as needed.)
Expert Solution
This question has been solved!
Explore an expertly crafted, step-by-step solution for a thorough understanding of key concepts.

This is a popular solution

Trending nowThis is a popular solution!

Step by stepSolved in 3 steps with 3 images

Knowledge Booster

Similar questions
- Prices and mileage of 48 Dodge 2500 Pickup trucks with Cummins diesel engines. Prices ranged from $28,925 to $68,650. Mileage ranged from 315 to 186,466. While I did not share the trucks were 2013 to 2020 models. Please show all work. Interpret b0 in the context of this problem. Interpret b1 in the context of this problem. What percent of total variation in prices is explained by the regression model? Provide evidence to support your answer. Price Mileage 52293 34450 50987 23372 62988 21738 37500 81176 66000 23118 47601 71143 47750 18214 42000 32303 50987 23372 28925 143737 42050 58561 51738 9691 51500 23969 44988 48781 29500 114809 46975 16918 63999 15507 46975 16918 43222 50459 38386 87192 42000 68722 62250 14042 62998 21738 32130 103644 52293 34450 52900 68883 53172 3656 53494 315 39594 88441 63246 23631 58250 34974 59391 18383 50650 42737 54976 84200 68650 14401 51114 47433 43900 74106 37450…arrow_forwardPredict the average lifespan of an animal in years when the incubation/gestation time is 12 months. Animal: Nile crocodile, Aldabra giant tortoise, Lake sturgeon,Galápagos tortoise, Bowhead whale Average Lifespan (in Years):100 152 152 177 211 Incubation/ Gestation (in Months)3 8 0.25 4.7 regression equation and regression line if neededarrow_forwardWhat percentage of the variation in infant mortality rate is explained by this model? Based on the results of the ANOVA table, is this a good model and why or why not? Is the relationship between percentage of GDP spent on healthcare and infant mortality rate statistically significant? What is the direction of the relationship? For each one percent increase in percentage of GDP spent on health care, we would expect the infant mortality rate to ________ (increase or decrease) by _____.arrow_forward
- Using the data, run a regression where you control for “Promotion,” and test the effect of “Wins” on “Attendance”. Does “Promotion” have a significant effect on “Attendance”? Wins Promotion Attendance 4 29500 36300 6 55700 40100 6 71300 41200 8 87000 53000 6 75000 44000 7 72000 45600 5 55300 39000 7 81600 47500arrow_forwarda) Determine the least squares regression equation for the population in years since 2005. Round the slope and y-intercept to the nearest tenth. b) Find the correlation coefficient, r-value, of the line. Round your answer to the nearest thousandth. c) Predict the population for the 2020. ____ thousand peoplearrow_forwardneed help with followingarrow_forward
- The data show the bug chirps per minute at different temperatures. Find the regression equation, letting the first variable be the independent (x) variable. Find the best predicted temperature for a time when a bug is chirping at the rate of 3000 chirps per minute. Use a significance level of 0.05. What is wrong with this predicted value? Chirps in 1 min 1118 796 1161 918 1103 1219 Temperature (F) 82 72.2 92.2 73 87.5 94.4arrow_forwardThe correct answer is option C but I do not know how to find the number that go inside it.arrow_forwardWhat is the explanatory variable, what is the response variable. What is the regression equation for this data. Plot the regression line in your calculator and draw it on your graph. Interpret in context the slope. Interpret in context the y-intercept. What is the residual at 45 years of age. Plot the residual plot on the axis to the rightarrow_forward
arrow_back_ios
arrow_forward_ios
Recommended textbooks for you
- A First Course in Probability (10th Edition)ProbabilityISBN:9780134753119Author:Sheldon RossPublisher:PEARSON

A First Course in Probability (10th Edition)
Probability
ISBN:9780134753119
Author:Sheldon Ross
Publisher:PEARSON