Write MATLAB code that will plot the function x² - 10x + 25 over the x values 0 to 10 on a regular plot (use the command plot) using 21 evenly spaced points with the linspace command in one subplot and then for the second subplot, plot the same function over the x values 10-¹ to 10 ¹ using 21 evenly spaced points on a semi logarithmic plot (use the command semilogx). Put markers on each point used in the calculations (using a circle, x, or +, your choice) using a different marker and color for each plot, and include axis labels on each subplot. If the code is written correctly, your subplots should appear like the ones below. 25 20 y-axis 15 10 X 5 0 0 x 2 X X 4 x-axis 6 8 X X 10 256 20 y-axis 15 10 5 0 10-1 O 10⁰ x-axis 0 0 0 0 0 Dood 10
Write MATLAB code that will plot the function x² - 10x + 25 over the x values 0 to 10 on a regular plot (use the command plot) using 21 evenly spaced points with the linspace command in one subplot and then for the second subplot, plot the same function over the x values 10-¹ to 10 ¹ using 21 evenly spaced points on a semi logarithmic plot (use the command semilogx). Put markers on each point used in the calculations (using a circle, x, or +, your choice) using a different marker and color for each plot, and include axis labels on each subplot. If the code is written correctly, your subplots should appear like the ones below. 25 20 y-axis 15 10 X 5 0 0 x 2 X X 4 x-axis 6 8 X X 10 256 20 y-axis 15 10 5 0 10-1 O 10⁰ x-axis 0 0 0 0 0 Dood 10

Computer Networking: A Top-Down Approach (7th Edition)
7th Edition
ISBN:9780133594140
Author:James Kurose, Keith Ross
Publisher:James Kurose, Keith Ross
Chapter1: Computer Networks And The Internet
Section: Chapter Questions
Problem R1RQ: What is the difference between a host and an end system? List several different types of end...

Related questions
Question
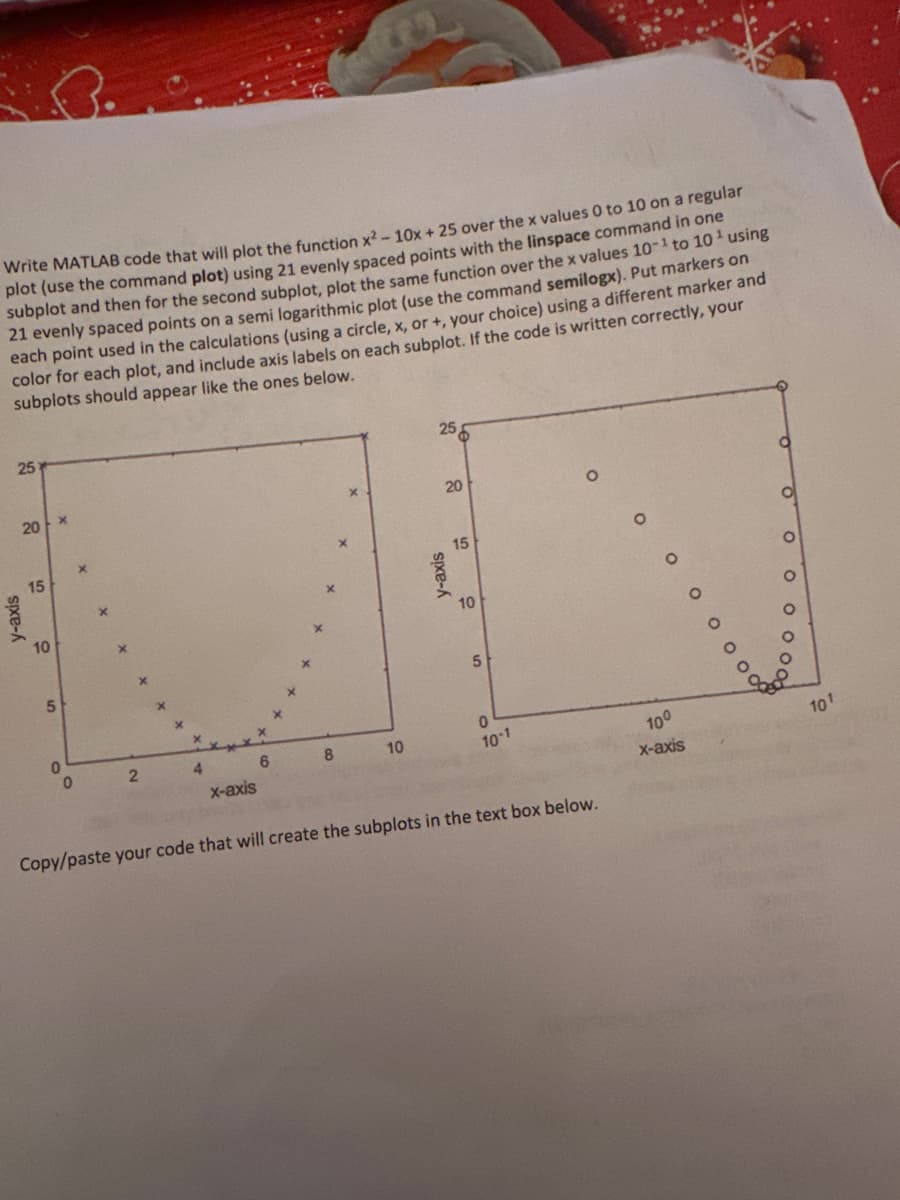
Transcribed Image Text:Write MATLAB code that will plot the function x² - 10x + 25 over the x values 0 to 10 on a regular
plot (use the command plot) using 21 evenly spaced points with the linspace command in one
subplot and then for the second subplot, plot the same function over the x values 10-¹ to 10 ¹ using
21 evenly spaced points on a semi logarithmic plot (use the command semilogx). Put markers on
each point used in the calculations (using a circle, x, or +, your choice) using a different marker and
color for each plot, and include axis labels on each subplot. If the code is written correctly, your
subplots should appear like the ones below.
25
y-axis
20
15
10
X
5
0
0
2
4
x-axis
6
8
10
25
PO
20
y-axis
15
10
5
0
10-1
O
Copy/paste your code that will create the subplots in the text box below.
0 0 0 0 0 0 0
10⁰
x-axis
0 0 0 0 0
10¹
Expert Solution
This question has been solved!
Explore an expertly crafted, step-by-step solution for a thorough understanding of key concepts.

This is a popular solution!

Trending now
This is a popular solution!

Step by step
Solved in 2 steps with 2 images

Recommended textbooks for you
Computer Networking: A Top-Down Approach (7th Edi…
Computer Engineering
ISBN:
9780133594140
Author:
James Kurose, Keith Ross
Publisher:
PEARSON

Computer Organization and Design MIPS Edition, Fi…
Computer Engineering
ISBN:
9780124077263
Author:
David A. Patterson, John L. Hennessy
Publisher:
Elsevier Science

Network+ Guide to Networks (MindTap Course List)
Computer Engineering
ISBN:
9781337569330
Author:
Jill West, Tamara Dean, Jean Andrews
Publisher:
Cengage Learning
Computer Networking: A Top-Down Approach (7th Edi…
Computer Engineering
ISBN:
9780133594140
Author:
James Kurose, Keith Ross
Publisher:
PEARSON
Computer Organization and Design MIPS Edition, Fi…
Computer Engineering
ISBN:
9780124077263
Author:
David A. Patterson, John L. Hennessy
Publisher:
Elsevier Science
Network+ Guide to Networks (MindTap Course List)
Computer Engineering
ISBN:
9781337569330
Author:
Jill West, Tamara Dean, Jean Andrews
Publisher:
Cengage Learning

Concepts of Database Management
Computer Engineering
ISBN:
9781337093422
Author:
Joy L. Starks, Philip J. Pratt, Mary Z. Last
Publisher:
Cengage Learning

Prelude to Programming
Computer Engineering
ISBN:
9780133750423
Author:
VENIT, Stewart
Publisher:
Pearson Education

Sc Business Data Communications and Networking, T…
Computer Engineering
ISBN:
9781119368830
Author:
FITZGERALD
Publisher:
WILEY