
MATLAB: An Introduction with Applications
6th Edition
ISBN: 9781119256830
Author: Amos Gilat
Publisher: John Wiley & Sons Inc
expand_more
expand_more
format_list_bulleted
Related questions
Question
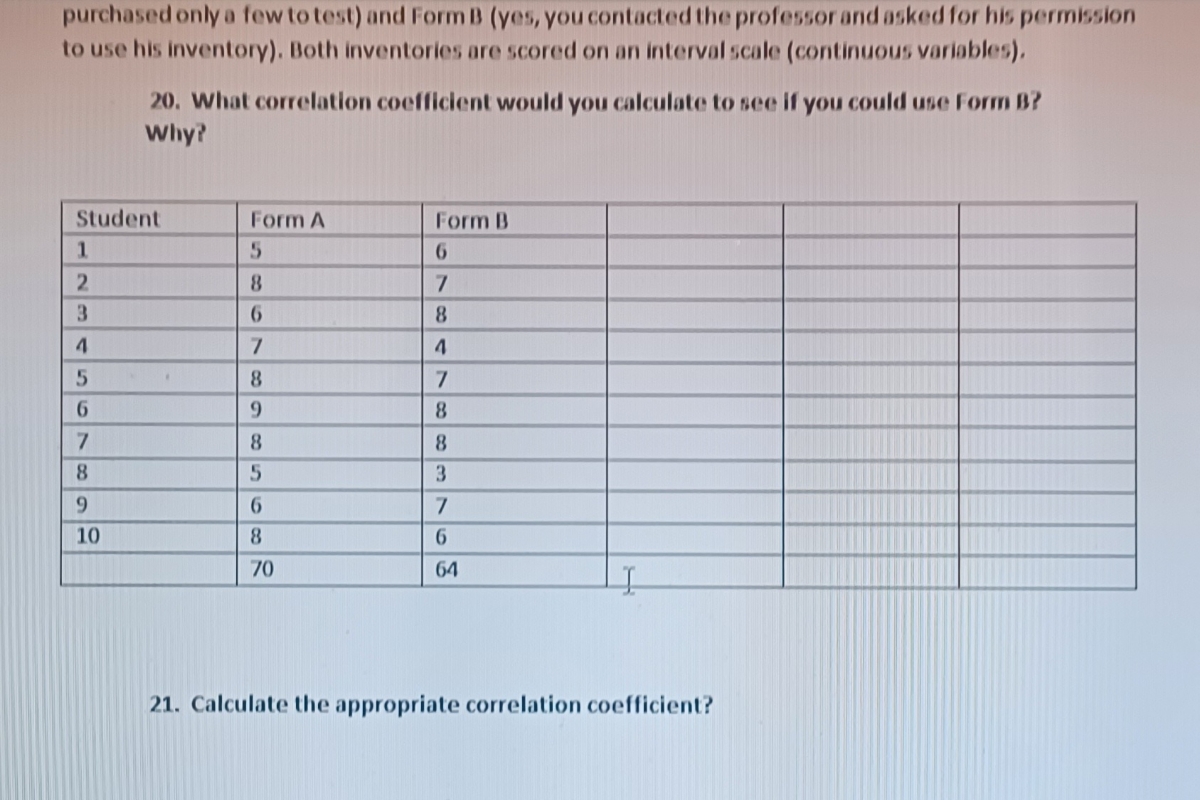

Transcribed Image Text:purchased only a few to test) and Form B (yes, you contacted the professor and asked for his permission
to use his inventory). Both inventories are scored on an interval scale (continuous variables).
Student
1
2
3
4
5
6
7
8
9
20. What correlation coefficient would you calculate to see if you could use Form B?
Why?
10
Form A
5
8
6
7
8
9
8
5
6
8
70
Form B
6
7
8
7
8
8
3
7
6
64
21. Calculate the appropriate correlation coefficient?

Transcribed Image Text:You are a professor interested in studying the relationship between social media and mental health. You
immerse yourself in the literature and read dozens of research articles. After reading the articles it was
evident the field claims adolescents with more than 100 social media interactions (post, likes,
comments, reactions) will have anxiety. You want to test this claim and decided to carry out a research
study. Before you go out to recruit adolescents at a middle school you need to choose an instrument to
use in your study that assess anxiety levels. You found two instruments after searching the internet. One
instrument, called Form A, cost money to use it and is the gold standard in assessing anxiety levels in
adolescent. The other instrument is a free instrument developed by a professor called Form B. You don't
want to spend a lot of money buying Form A. If Form A positively correlated with Form B you can justify
using Form B in your study. You get a random sample of 10 adolescents and give them Form A (yes you
purchased only a few to test) and Form B (yes, you contacted the professor and asked for his permission
to use his inventory). Both inventories are scored on an interval scale (continuous variables).
Student
1
2
3
4
5
6
20. What correlation coefficient would you calculate to see if you could use Form B?
Why?
7
8
a
Form A
5
8
6
7
8
9
8
5
Form B
6
7
8
4
7
8
8.
3
I
Expert Solution
This question has been solved!
Explore an expertly crafted, step-by-step solution for a thorough understanding of key concepts.

This is a popular solution

Trending nowThis is a popular solution!

Step by stepSolved in 4 steps with 17 images

Knowledge Booster

Similar questions
- You wish to determine the impact expressive writing has on days spent in the hospital for elderly adults. However, it is difficult to estimate the population average of days spent in the hospital. Thus, we recruit 14 elderly adults and randomly assigned half to either write expressively about their most traumatic life event or to write about their plans for that day- both groups write 20-minute essays four days in a row and six months later are asked how many days they have spent in the hospital. Expressive writing condition: 2, 5, 1, 4, 4, 2, 3 Control condition: 8, 8, 5, 2, 7, 5, 7 Which statistical test would you select: Ho: H₁: Enter the data above into and JAMOVI and use the correct statistical procedure to test the null hypothesis - answer the following questions: What is the mean difference between the two samples? What is the standard error of the mean? What is the appropriate 95% CI? [ What is the d-effect size? What is the t-observed? } Based on the p-value (a = .05) should…arrow_forwardDoes the shape or color of a pain pill influence its effectiveness? Although logically it shouldn’t, whether we believe a drug will work does have a powerful effect on our perceptions (e.g., placebo effect). In this experiment, 4 groups of adult patients were given the same amount of Advil after dental surgery for pain relief, but the color and shape of the pill varied. Researchers hypothesized that an unusual shape or color would lead people to believe the pills were new and special and thus would expect them to be more effective than common round, white pills. Researchers also wanted to know if there is an interaction between shape and color what is the purpose and design of the study as well as the characteristics of the participants in the sample?arrow_forwardA study was conducted to explore the prevalence and impact of sleep problems on various aspects of people's lives. Staff from a university in Melbourne, Australia were invited to complete a questionnaire containing questions about their sleep behaviour (e.g. hours slept per night), sleep problems (e.g. difficulty getting to sleep) and the impact that these problems have on aspects of their lives (work, driving, relationships). The sample consisted of 271 respondents (55% female, 45% male) ranging in age from 18 to 84 years (M=43.9yrs). A student researcher is interested in examining whether the participants in the study sleep for 8 hours a night, the recommended average for adults. Proposed analysis and why you chose the analysis? Measurement type (i.e., nominal, ordinal, continuous) for variable(s) that will be used in the analysis? Null and alternative hypotheses (based on context of study) in symbols? id sex age weight height sleep 83 0 42 52 162 9…arrow_forward
- A marketing agency wanted to determine if a new commercial changed people's opinion about a company. They recruited n=30 participants to watch the commercial. First, everyone was givien a survey to determine their attitudes toward the company. Then, everyone watched the new commercial. Finally, they were given the same survey again and asked about their attitudes toward the comapny after seeing the commercial. The agency wanted to see if attitudes were changed by the commercial. What statistical test should they use?arrow_forwardYou want to compare males and females in their use of coping strategies when engaged in conflict in relationships. You send surveys to couples obtained from marriage license application at the county clerk's office. You identify several distinct coping strategies on the survey and have the respondents rate their use of each strategy on a 7-point scale. You then compare scores that come from the two members of each relationship. If testing hypotheses about the effects of gender on use of coping strategies, it would be most appropriate to calculate a ... 1) independent-samples t 2) one sample t 3) paired samples t 4) z testarrow_forwardAn apartment management company wants to explore the consequences of allowing residents to have multiple dogs. They would like to find out whether the number of dogs predicts resident ratings. They would also like to control for the year the apartment complex was built because that might also affect the resident rating. They have collected data on several of their existing complexes. For each complex, they have counted the number of dogs currently living in the complex, the year the complex was built, and the average rating for that particular complex. They would like to perform a multiple regression on these variables to predict resident ratings. See data below. These data are the same as the previous question. Positive and Negative Dog Ratings Number of dogs Year of facility Rating (out of 5) 54 1975 2 31 1964 3.5 0 2015 4.8 11 2011 3.8 73 1964 2.3 23 2016 3.7 0 2015 4.7 49 1989 2.7 What can we conclude about this multiple regression analysis? Fill in the…arrow_forward
- Tobacco companies have actively attempted to remake their public image by launching a youth smoking prevention advertisement campaign. Melanie Wakefield (a professor of applied psychology and researcher at the Center for Behavioral Research in Cancer in Victoria, Australia) and her colleagues conducted a study to assess the relation between exposure to tobacco companies' youth smoking prevention advertising and youth smoking-related beliefs, intentions, and behaviors. You use Professor Wakefield's research to design an experiment with two groups of middle school students from Vietnam. You show the tobacco company's youth smoking prevention ads to one of the groups of students every day for a week at the beginning of their math class. After the week, you assess the groups on the degree to which the students approve/disapprove of teens smoking, using a 5-point Likert scale. You do not have a prediction about the effect of the ads, as they are supposed to prevent smoking, but Professor…arrow_forwardYou're a healthcare analytics professional working for Pawhuska, Oklahoma's fourth-largest hospital. You're examining the amount of waiting time that patients classified as ES5 (those with ailments that are not life-threatening) spend in the emergency room. You'll make some changes to emergency room procedures if you find that the mean ES5 waiting time is longer than 18 minutes, the industry standard. Based on a sample of 22 ES5 patients, you found an average and standard deviation of waiting times to be 19.2 minutes and 2.4 minutes, respectively. Draw basic conclusions with the CRITICAL VALUE APPROACH with 99% confidence. Р What is the probability that you conclude that no changes in the emergency room are needed when the actual waiting time for ES5 patients is 20 minutes?arrow_forwardIn 2013 students from a Statistics class at FSEV UK were asked to survey their friends who were 15-30 years old, in order to explore the interests of young people. The survey has a variety of questions, which are detailed in the Survey Key. For example, the column header “Music” is short for the question “I enjoy listening to music” and is rated 1-5, where 1 represents strongly disagree and 5 represents strongly agree. There is also some categorical data present as well. Survey participants record their gender, how often they smoke/drink, their internet usage, and education (just to name a few!). Please perform a hypothesis test based on one of the categorical variables and one survey question. For example, you could choose to prove the following: Survey participants who identify as an “only child” enjoy meeting new people (Survey score ). Here is an example: people who are right-handed (as identified in the data set) enjoy listening to music. Please be sure to use two columns…arrow_forward
- A researcher gathered a sample of participants who volunteered for a studying of phobias. She measured anxiety level of participants as they viewed photos of spiders and again when they viewed puppies. Which statistical test is appropriate for this study and why?arrow_forwardYou will conduct a study of 100 people with cancer to better understand people's view the role of nutrition in their cancer diagnosis and treatment. This mixed methods study will include quantitative data collection from all 100 persons and qualitative data collection from about 20 persons. Your aims to to describe: o Describe sources of information about cancer-related nutrition (who did they learn cancer- related information from?) o Assess knowledge about cancer-related nutrition o Understand nutrition-related behaviors people changed due to their cancer diagnosis or treatment State which aims would best be measured with quantitative data and which aims would best be measured with qualitative data. Explain why you would use quantitative or qualitative data collection for each.arrow_forwardThere are 64% of US adults who own a smartphone, up from 35% in 2011. Smartphones have become an important way for Americans to communicate, go online, access and share information. The Pew Research Center surveyed 1635 people in November, 2014 on smartphone ownership. Their goal was to learn how Americans use their smartphone devices. Identify the population and the sample.arrow_forward
arrow_back_ios
SEE MORE QUESTIONS
arrow_forward_ios
Recommended textbooks for you
- MATLAB: An Introduction with ApplicationsStatisticsISBN:9781119256830Author:Amos GilatPublisher:John Wiley & Sons Inc
 Probability and Statistics for Engineering and th...StatisticsISBN:9781305251809Author:Jay L. DevorePublisher:Cengage Learning
 Statistics for The Behavioral Sciences (MindTap C...StatisticsISBN:9781305504912Author:Frederick J Gravetter, Larry B. WallnauPublisher:Cengage Learning
  Elementary Statistics: Picturing the World (7th E...StatisticsISBN:9780134683416Author:Ron Larson, Betsy FarberPublisher:PEARSON
 The Basic Practice of StatisticsStatisticsISBN:9781319042578Author:David S. Moore, William I. Notz, Michael A. FlignerPublisher:W. H. Freeman
 Introduction to the Practice of StatisticsStatisticsISBN:9781319013387Author:David S. Moore, George P. McCabe, Bruce A. CraigPublisher:W. H. Freeman
MATLAB: An Introduction with Applications
Statistics
ISBN:9781119256830
Author:Amos Gilat
Publisher:John Wiley & Sons Inc
Probability and Statistics for Engineering and th...
Statistics
ISBN:9781305251809
Author:Jay L. Devore
Publisher:Cengage Learning
Statistics for The Behavioral Sciences (MindTap C...
Statistics
ISBN:9781305504912
Author:Frederick J Gravetter, Larry B. Wallnau
Publisher:Cengage Learning
Elementary Statistics: Picturing the World (7th E...
Statistics
ISBN:9780134683416
Author:Ron Larson, Betsy Farber
Publisher:PEARSON
The Basic Practice of Statistics
Statistics
ISBN:9781319042578
Author:David S. Moore, William I. Notz, Michael A. Fligner
Publisher:W. H. Freeman
Introduction to the Practice of Statistics
Statistics
ISBN:9781319013387
Author:David S. Moore, George P. McCabe, Bruce A. Craig
Publisher:W. H. Freeman