
Videos
(a)
To Calculate: the appropriate percents for comparing male and female students’ goals
(a)
Answer to Problem 10.63RE
| Grades | Popular | Sports | Total | ||
| Female | Observed | 130 | 91 | 30 | 251 |
| % of row | 51.8% | 36.3% | 12.0% | 100.0% | |
| Male | Observed | 117 | 50 | 60 | 227 |
| % of row | 51.5% | 22.0% | 26.4% | 100.0% | |
| Total | Observed | 247 | 141 | 90 | 478 |
| % of row | 51.7% | 29.5% | 18.8% | 100.0% |
Explanation of Solution
Given:
| Gender | Grades | Popular | Sports |
| Female | 130 | 91 | 30 |
| Male | 117 | 50 | 60 |
Calculation:
Row and column totals are as
| Gender | Grades | Popular | Sports | Total |
| Female | 130 | 91 | 30 | 251 |
| Male | 117 | 50 | 60 | 227 |
| Total | 247 | 141 | 90 | 478 |
The proportion of females with each goal and the proportion of males with each goal
| Grades | Popular | Sports | Total | ||
| Female | Observed | 130 | 91 | 30 | 251 |
| % of row | 51.8% | 36.3% | 12.0% | 100.0% | |
| Male | Observed | 117 | 50 | 60 | 227 |
| % of row | 51.5% | 22.0% | 26.4% | 100.0% | |
| Total | Observed | 247 | 141 | 90 | 478 |
| % of row | 51.7% | 29.5% | 18.8% | 100.0% |
(b)
To construct: a well-label bar graph to compare male and female responses and write the few sentences describing the relationship between gender and goals.
(b)
Explanation of Solution
Graph:
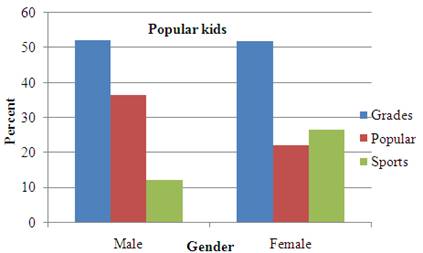
By seeing the bar graph, it is representing that the most of the male and female have the good grades. Minority of male find the sports and about the equal proportion of females find the popular and sports and less male looks find sports less important compared to males
Chapter 10 Solutions
Statistics Through Applications
Additional Math Textbook Solutions
Elementary Statistics Using Excel (6th Edition)
Introductory Statistics
Essentials of Statistics, Books a la Carte Edition (5th Edition)
An Introduction to Mathematical Statistics and Its Applications (6th Edition)
Elementary Statistics: Picturing the World (7th Edition)
Statistical Reasoning for Everyday Life (5th Edition)


 MATLAB: An Introduction with ApplicationsStatisticsISBN:9781119256830Author:Amos GilatPublisher:John Wiley & Sons Inc
 Probability and Statistics for Engineering and th...StatisticsISBN:9781305251809Author:Jay L. DevorePublisher:Cengage Learning
 Statistics for The Behavioral Sciences (MindTap C...StatisticsISBN:9781305504912Author:Frederick J Gravetter, Larry B. WallnauPublisher:Cengage Learning
 Elementary Statistics: Picturing the World (7th E...StatisticsISBN:9780134683416Author:Ron Larson, Betsy FarberPublisher:PEARSON
 The Basic Practice of StatisticsStatisticsISBN:9781319042578Author:David S. Moore, William I. Notz, Michael A. FlignerPublisher:W. H. Freeman
 Introduction to the Practice of StatisticsStatisticsISBN:9781319013387Author:David S. Moore, George P. McCabe, Bruce A. CraigPublisher:W. H. Freeman