
Concept explainers
Videos
(a)
To construct: Graph for the distribution of grade levels for the sample data.
(a)
Explanation of Solution
Given:
Percentage of freshman
Percentage of sophomores
Percentage of juniors
Percentage of seniors
Number of freshman in a sample
Number of sophomores in a sample
Number of juniors in a sample
Number of seniors in a sample
Calculation:
Total number of students in a sample
Finding percentages:
Freshman:
Sophomores:
Juniors:
Seniors:
Graph:
For sample data
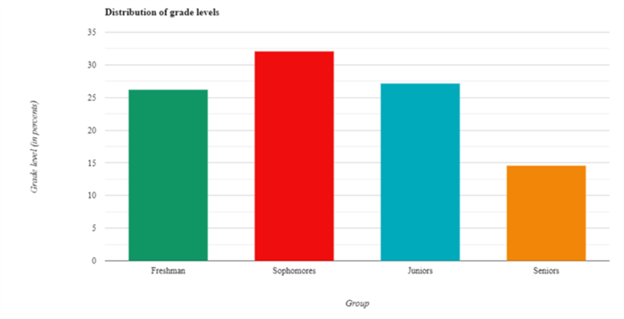
Interpretation:
From the above graph, it can be seen that most of the students are in sophomores group and then in juniors group, whereas, the claimed percentage says that most of the students lie in freshman group.
Hence, the statistics sample seems unusual.
(b)
To check: Whether the sample distribution differs from actual distribution or not.
(b)
Answer to Problem 1CRE
The sample distribution do not differ from actual distribution
Explanation of Solution
Formula used:
Calculation:
The expected count will be
| E | |
| Freshman | |
| Sophomores | |
| Juniors | |
| Seniors |
The observed (O) and expected (E) counts are
| Expected (E) | Observed (O) | |
| Freshman | ||
| Sophomores | ||
| Juniors | ||
| Seniors |
The null and alternate hypotheses are
Test statistic
The test value is
P value
Conclusion:
As the p value is greater than significance level, so there is insufficient evidence to reject null hypothesis at
Want to see more full solutions like this?
Chapter 11 Solutions
The Practice of Statistics for AP - 4th Edition
Additional Math Textbook Solutions
Essentials of Statistics, Books a la Carte Edition (5th Edition)
Introductory Statistics (10th Edition)
Elementary Statistics: Picturing the World (6th Edition)
Introductory Statistics (2nd Edition)
Introductory Statistics
Statistics: The Art and Science of Learning from Data (4th Edition)


 MATLAB: An Introduction with ApplicationsStatisticsISBN:9781119256830Author:Amos GilatPublisher:John Wiley & Sons Inc
 Probability and Statistics for Engineering and th...StatisticsISBN:9781305251809Author:Jay L. DevorePublisher:Cengage Learning
 Statistics for The Behavioral Sciences (MindTap C...StatisticsISBN:9781305504912Author:Frederick J Gravetter, Larry B. WallnauPublisher:Cengage Learning
 Elementary Statistics: Picturing the World (7th E...StatisticsISBN:9780134683416Author:Ron Larson, Betsy FarberPublisher:PEARSON
 The Basic Practice of StatisticsStatisticsISBN:9781319042578Author:David S. Moore, William I. Notz, Michael A. FlignerPublisher:W. H. Freeman
 Introduction to the Practice of StatisticsStatisticsISBN:9781319013387Author:David S. Moore, George P. McCabe, Bruce A. CraigPublisher:W. H. Freeman