
Concept explainers
Videos
a.
To find the distribution of responses about whether there was broken glass at the accident for each of the three treatment groups in the table given. To make a segmented bar graph to compare these distributions.
a.
Answer to Problem 29E
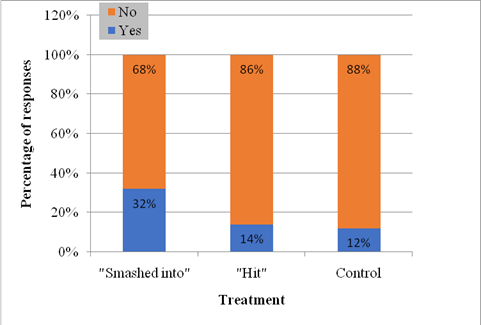
The result for the distribution of responses of the three treatment groups is as below:
| Response | Treatment | ||
| "Smashed into" | "Hit" | Control | |
| Yes | 32% | 14% | 12% |
| No | 68% | 86% | 88% |
The segmented bar graph to compare these distributions is as below:
Explanation of Solution
Given:
The study includes 150 subjects, while 50 subjects are assigned to each three treatment groups. The table below shows each group's response to the broken glass question.
| Response | Treatment | ||
| "Smashed into" | "Hit" | Control | |
| Yes | 16 | 7 | 6 |
| No | 34 | 43 | 44 |
Concept Used:
Firstly, determine the distribution of responses for each of the three treatment groups, by dividing each count by 50 as there are 50 subjects assigned to each treatment. Then, make a segmented bar graphto compare these distributions.
Calculation:
Determine the distribution of responses caused in each of the three treatment groups:
| Response | Treatment | ||
| "Smashed into" | "Hit" | Control | |
| Yes | |||
| No | |||
Create a segmented bar graph, where in the width of each bars should be equal and the height should be equal to the percentage of responses as shown below.

b.
To describe the association between response about broken glass at the accident and treatment received for the subjects in the study from the segmented bar graph obtained in part (a).
b.
Answer to Problem 29E
We note that the proportion of subjects who said they saw broken glass at the accident is much higher for the "Smashed into" treatment compared to the other two treatments.
We also note that there does not appear to be a large difference in the response between the "Hit" treatment and in the Control treatment.
Explanation of Solution
We note that the proportion of subjects who said they saw broken glass at the accident is much higher for the "Smashed into" treatment compared to the other two treatments (as the blue section in the bar graph is largest for "Smashed into").
We also note that there does not appear to be a large difference in the response between the "Hit" treatment and in the Control treatment, because the bars corresponding to those treatment are very similar.
Chapter 1 Solutions
PRACTICE OF STATISTICS F/AP EXAM
Additional Math Textbook Solutions
Basic Business Statistics, Student Value Edition (13th Edition)
Essentials of Statistics, Books a la Carte Edition (5th Edition)
Intro Stats
Statistical Reasoning for Everyday Life (5th Edition)
Elementary Statistics Using Excel (6th Edition)
Introductory Statistics (2nd Edition)


 MATLAB: An Introduction with ApplicationsStatisticsISBN:9781119256830Author:Amos GilatPublisher:John Wiley & Sons Inc
 Probability and Statistics for Engineering and th...StatisticsISBN:9781305251809Author:Jay L. DevorePublisher:Cengage Learning
 Statistics for The Behavioral Sciences (MindTap C...StatisticsISBN:9781305504912Author:Frederick J Gravetter, Larry B. WallnauPublisher:Cengage Learning
 Elementary Statistics: Picturing the World (7th E...StatisticsISBN:9780134683416Author:Ron Larson, Betsy FarberPublisher:PEARSON
 The Basic Practice of StatisticsStatisticsISBN:9781319042578Author:David S. Moore, William I. Notz, Michael A. FlignerPublisher:W. H. Freeman
 Introduction to the Practice of StatisticsStatisticsISBN:9781319013387Author:David S. Moore, George P. McCabe, Bruce A. CraigPublisher:W. H. Freeman