DATA The statistical quantities “average value” and “root-mean-square value” can be applied to any distribution. Figure P18.82 shows the scores of a class of 150 students on a 100-point quiz. (a) Find the average score for the class. (b) Find the rms score for the class. (c) Which is higher: the average score or the rms score? Why? Figure P18.82 altitude of about 11 km, the temperature is not uniform but decreases with increasing elevation. (a) Show that if the temperature variation is approximated by the linear relationship T = T 0 − α y where T 0 is the temperature at the earth’s surface and T temperature at height y , the pressure p at height y is ln ( p p 0 ) = M g R α ln ( T 0 − α y T 0 ) where P 0 is the pressure at the earth’s surface and M is the molar mass for air. The coefficient α is called the lapse rate of temperature. It varies with atmospheric conditions, but an average value is about 0.6 C°/100 m. (b) Show that the above result reduces to the result of Example 18.4 (Section 18.1) in the limit that α → 0. (c) With α = 0 6 C°/100 m, calculate p for y = 8863 m and compare your answer to the result of Example 18.4. Take T 0 = 288 K and p 0 = 1.00 atm.
DATA The statistical quantities “average value” and “root-mean-square value” can be applied to any distribution. Figure P18.82 shows the scores of a class of 150 students on a 100-point quiz. (a) Find the average score for the class. (b) Find the rms score for the class. (c) Which is higher: the average score or the rms score? Why? Figure P18.82 altitude of about 11 km, the temperature is not uniform but decreases with increasing elevation. (a) Show that if the temperature variation is approximated by the linear relationship T = T 0 − α y where T 0 is the temperature at the earth’s surface and T temperature at height y , the pressure p at height y is ln ( p p 0 ) = M g R α ln ( T 0 − α y T 0 ) where P 0 is the pressure at the earth’s surface and M is the molar mass for air. The coefficient α is called the lapse rate of temperature. It varies with atmospheric conditions, but an average value is about 0.6 C°/100 m. (b) Show that the above result reduces to the result of Example 18.4 (Section 18.1) in the limit that α → 0. (c) With α = 0 6 C°/100 m, calculate p for y = 8863 m and compare your answer to the result of Example 18.4. Take T 0 = 288 K and p 0 = 1.00 atm.
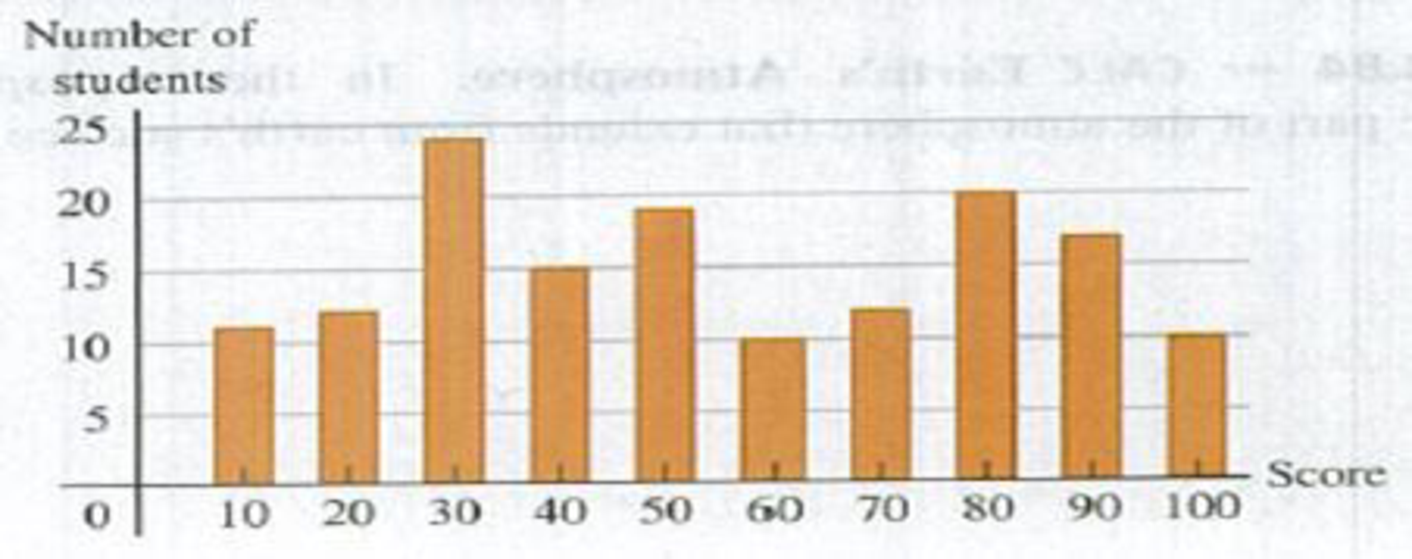
DATA The statistical quantities “average value” and “root-mean-square value” can be applied to any distribution. Figure P18.82 shows the scores of a class of 150 students on a 100-point quiz. (a) Find the average score for the class. (b) Find the rms score for the class. (c) Which is higher: the average score or the rms score? Why?
Figure P18.82
altitude of about 11 km, the temperature is not uniform but decreases with increasing elevation. (a) Show that if the temperature variation is approximated by the linear relationship
T
=
T
0
−
α
y
where T0 is the temperature at the earth’s surface and T temperature at height y, the pressure p at height y is
ln
(
p
p
0
)
=
M
g
R
α
ln
(
T
0
−
α
y
T
0
)
where P0 is the pressure at the earth’s surface and M is the molar mass for air. The coefficient α is called the lapse rate of temperature. It varies with atmospheric conditions, but an average value is about 0.6 C°/100 m. (b) Show that the above result reduces to the result of Example 18.4 (Section 18.1) in the limit that α → 0. (c) With α = 0 6 C°/100 m, calculate p for y = 8863 m and compare your answer to the result of Example 18.4. Take T0 = 288 K and p0 = 1.00 atm.
A Fahrenheit and a Celsius thermometer are both immersed in a fluid. a) If the two numerical readings
are identical, what is the temperature of the fluid expressed in °K and °R. b) If the Fahrenheit
temperature is numerically twice that of the Celsius reading, what is the temperature of the fluid
expressed in °K and °R?
H.W:
A mass flow rate m(g/s) is measured as a function of temperature T(°C).
T
10
20
40
80
m 14.76 20.14 27.73 38.47
There is reason to believe that m varies linearly with the square root of T:
m = aT/2 + b
Use a straight-line plot to verify this formula and determine a and b.
5. An automobile tire contains 3730 cubic inch of air and 32 psig and 80 degrees
fahrenheit. (a) what mass of air is in the tire? (b) In operation, the air temperature
increases to 145 degrees fahrenheit. if the tire is inflexible what is the resulting
percentage increase in gauge pressure? (c) what mass of the 145 degrees fahrenheit
air must be bled off to reduce the pressure back to its original value?
R = 53.342 ft.lb/lb.R.
Need a deep-dive on the concept behind this application? Look no further. Learn more about this topic, physics and related others by exploring similar questions and additional content below.
The Laws of Thermodynamics, Entropy, and Gibbs Free Energy; Author: Professor Dave Explains;https://www.youtube.com/watch?v=8N1BxHgsoOw;License: Standard YouTube License, CC-BY


 Physics for Scientists and Engineers: Foundations...PhysicsISBN:9781133939146Author:Katz, Debora M.Publisher:Cengage Learning
 College PhysicsPhysicsISBN:9781305952300Author:Raymond A. Serway, Chris VuillePublisher:Cengage Learning
 Physics for Scientists and EngineersPhysicsISBN:9781337553278Author:Raymond A. Serway, John W. JewettPublisher:Cengage Learning
 Physics for Scientists and Engineers with Modern ...PhysicsISBN:9781337553292Author:Raymond A. Serway, John W. JewettPublisher:Cengage Learning
 Principles of Physics: A Calculus-Based TextPhysicsISBN:9781133104261Author:Raymond A. Serway, John W. JewettPublisher:Cengage Learning
 Physics for Scientists and Engineers, Technology ...PhysicsISBN:9781305116399Author:Raymond A. Serway, John W. JewettPublisher:Cengage Learning