
Principles of Economics 2e
2nd Edition
ISBN: 9781947172364
Author: Steven A. Greenlaw; David Shapiro
Publisher: OpenStax
expand_more
expand_more
format_list_bulleted
Textbook Question
Chapter 19, Problem 30P
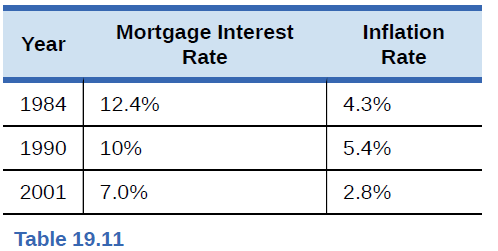
A mortgage 105m is a loan that a person makes to purchase a house. Table 19.11 provides a list of the mortgage interest rate for several different years and the rate of inflation for each of those years. In which years would it have been better to be a person borrowing money from a bank to buy a home? In which years would it have been better to be a bank lending money?
Expert Solution & Answer
Want to see the full answer?
Check out a sample textbook solution
Students have asked these similar questions
Imagine that you borrow $5,000 for one year and at the end of the year you repay the $5,000 plus $600 of interest. If the inflation rate was 4%, what was the real interest rate you paid?
Assume that Sarah agrees to lend $100 to Sam for
one year. Sam agrees to pay Sarah $117 at the end of
the year. If inflation over that one year is 8%, what
real rate of interest does Sarah earn on her $100?
What is the inflation rate for 2015?
Chapter 19 Solutions
Principles of Economics 2e
Ch. 19 - Country A has export sales of 20 billion,...Ch. 19 - Which of the following are included in GDP, and...Ch. 19 - Using data from Table 19.5 how much of the nominal...Ch. 19 - Without looking at Table 19.7, return to Figure...Ch. 19 - According to Table 19.7, how often have recessions...Ch. 19 - According to Table 19.7, how long has the average...Ch. 19 - According to Table 19.7, how long has the average...Ch. 19 - Is it possible for GDP to rise while at the same...Ch. 19 - The Central African Republic has a GDP of...Ch. 19 - Explain briefly whether each of the following...
Ch. 19 - What are the main components of measuring GDP with...Ch. 19 - What are the main components of measuring GDP with...Ch. 19 - Would you usually expect GDP as measured by what...Ch. 19 - Why must you avoid double counting when measuring...Ch. 19 - What is the difference between a series of...Ch. 19 - How do you convert a series of nominal economic...Ch. 19 - What are typical GDP patterns for a high-income...Ch. 19 - What are the two main difficulties that arise in...Ch. 19 - List some of the reasons why economists should not...Ch. 19 - U.S. macroeconomic data are among the best in the...Ch. 19 - What does GDP not tell us about the economy?Ch. 19 - Should people typically pay more attention to...Ch. 19 - Why do you suppose that U.S. GDP is so much higher...Ch. 19 - Why do you think that GDP does not grow at a...Ch. 19 - Cross country comparisons of GDP per capita...Ch. 19 - Why might per capita GDP be only an imperfect...Ch. 19 - How might you measure a green GDP?Ch. 19 - Last year, a small nation with abundant forests...Ch. 19 - The prime interest rate is the rate that banks...Ch. 19 - A mortgage 105m is a loan that a person makes to...Ch. 19 - Ethiopia has a GDP of 8 billion (measured in U.S....Ch. 19 - In 1980, Denmark had a GDP of 70 billion (measured...Ch. 19 - The Czech Republic has 3 GDP of 1,800 billion...
Additional Business Textbook Solutions
Find more solutions based on key concepts
Identify whether each of the following accounts would be considered a permanent account (yes/no) and which fina...
Principles of Accounting Volume 1
Define cost pool, cost tracing, cost allocation, and cost-allocation base.
Horngren's Cost Accounting: A Managerial Emphasis (16th Edition)
E2-13 Identifying increases and decreases in accounts and normal balances
Learning Objective 2
Insert the mis...
Horngren's Accounting (12th Edition)
What is the best way to control labor costs? What tools are discussed in the chapter that may be used to help c...
Construction Accounting And Financial Management (4th Edition)
Using the weighted-average method, compute the equivalent units of production if the beginning inventory consis...
Principles of Accounting Volume 2
Ravenna Candles recently purchased candleholders for resale in its shops. Which of the following costs would be...
Financial Accounting (12th Edition) (What's New in Accounting)
Knowledge Booster

Similar questions
- The monthly market basket for consumers consists of pizza, t-shirts, and rent. The table below shows market basket quantities and prices for the base year (Year 1) and in the following two years. The inflation rate between Year 1 and Year 2 is The inflation rate between Year 2 and Year 3 is Product Pizza T-Shirts Rent Base Year (Year 1) Quantity 15 3 1 Price in the Base Year % (Round both answers to one decimal place.) %. $2.50 $15.00 $450.00 Price in Year 2 $3.13 $13.50 $495.00 Price in Year 3 $3.75 $15.00 $585.00arrow_forwardOver the last 10 years, the average rate of inflation has been 1.61%. what is the purchasing power of a dollar today in terms of what a dollar could purchase in 2008?arrow_forwardIncome in year 1: $50,000 Income in year 2: $60,000 CPI in year 1 = 100 CPI in year 2 = 110 what happened to nominal income between year 1 and year 2? what is real income in year 1 and year 2? what is the inflation rate?arrow_forward
- Suppose there are 1200 units of money on an island, but money grows by 5.32% per year. Islanders spend each unit of money 2.3 times per year on average and this spending grows by 1.98%. The price level is at 34. GDP is expected to grow at 4.83%. What is the level of inflation? Answer this as a percentage without the percentage sign and round this to two digits after the decimal. ex. If you found the rate to be 5.125%, answer 5.13.arrow_forwardWhat are the impacts of inflation for borrowers and savers?arrow_forwardThe following table gives the average nominal interest rates on six-month Treasury bills spanning the years 1971 and 1975, which determined the nominal interest rate paid by the U.S. government when it issued debt in that time period. The table also gives the inflation rate for the years 1971 to 1975. (All rates rounded to the nearest 0.1 percent.) Year 1971 1972 1973 INTEREST RATE (Percent) 1974 1975 8.0 Source: "FRED Economic Data," Federal Reserve Bank of St. Louis, last modified September 23, 2019, accessed September 24, 2019, https://fred.stlouisfed.org. 7.0 On the following graph, use the orange points (square symbol) to plot the nominal interest rates for the years 1971 to 1975. Next, use the green points (triangle symbol) to plot the real interest rates for those years. 6.0 5.0 4.0 3.0 2.0 1.0 0 -1.0 + -2.0 -3.0 Nominal Interest Rate (Percent) 4.5 4.5 7.2 1970 OOOO O 1971 O 1972 O 1973 8.0 O 1974 6.1 1971 O 1975 Inflation Rate (Percent) 4.2 3.3 6.3 11.0 9.1 1972 1973 YEAR 1974…arrow_forward
- In which situation would you rather be a borrower? the nominal interest rate is 10%, the inflation rate is 9% the nominal interest rate is 8%, the inflation rate is 6% the nominal interest rate i 6%, the inflation rate is 3% the nominal interest rate is 4%, the inflation rate is 0%arrow_forwardSuppose in the 1982 base year a typical market basket purchased by an urban family cost $250. In 1996, the same market basket cost $1,000. The same market basket also cost $950 in 1995. A) What is the consumer price index (CPI) for 1996? B) What is the consumer price index (CPI) for 1995? C) What was the annual rate of inflation for 1996? d) Answer the Question in detail on the image providedarrow_forwardThe following table shows the average nominal interest rates on six-month Treasury bills between 2014 and 2018, which determined the nominal interest rate that the U.S. government paid when it issued debt in those years. The table also shows the inflation rate for the years 2014 to 2018. (All rates are rounded to the nearest tenth of a percent.) Year Nominal Interest Rate Inflation Rate (Percent) (Percent) 2014 0.1 1. 6 2015 0.2 0.1 2016 0.5 1.3 2017 1.1 2.1 2018 2.1 2.4 On the following graph, use the orange points (square symbol) to plot the nominal interest rates for the years 2014 to 2018. Next, use the green points (triangle symbol) to plot the real interest rates for those years. According to the table, in which year did buyers of six-month Treasury…arrow_forward
- The steps involved in calculating the consumer price index, in order, are as follows: * Choose a base year, fix the basket, compute the inflation rate, compute the basket's cost, and compute the index. Choose a base year, find the prices, fix the basket, compute the basket's cost, and compute the index. Fix the basket, find the prices, compute the basket's cost, choose a base year and compute the index. Fix the basket, find the prices, compute the inflation rate, choose a base year and compute the index.arrow_forwardQuantity Quantity Item (2018) Price (2018) (2019) Price (2019) Magazines 400 $5.00 450 $4.50 Movie tickets 50 $6.00 200 $8.00 Pizzas 100 $10.00 120 $10.50 The data in the table above shows the consumption by families in an economy. The year 2018 is the reference base period. Based on the table above, between 2018 and 2019, the inflation rate in this country was 2.5 percent. 98.5 percent. -1.5 percent. 105.1 percent. -2.5 percent.arrow_forward
arrow_back_ios
arrow_forward_ios
Recommended textbooks for you

 Economics (MindTap Course List)EconomicsISBN:9781337617383Author:Roger A. ArnoldPublisher:Cengage Learning


Economics (MindTap Course List)
Economics
ISBN:9781337617383
Author:Roger A. Arnold
Publisher:Cengage Learning