
Videos
The Excel file Syringe Samples provides data for
To define the range names for each of these samples and then use the range names in formulas to find the average values of each samples.
Explanation of Solution
Given:
The Syringe samples data for the fifteen samples in the excel file is as follows:
| Sample | Sample Observations | ||||
| S1 | 4.9600 | 4.9460 | 4.9500 | 4.9560 | 4.9580 |
| S2 | 4.9580 | 4.9270 | 4.9350 | 4.9400 | 4.9500 |
| S3 | 4.9710 | 4.9290 | 4.9650 | 4.9520 | 4.9380 |
| S4 | 4.9400 | 4.9820 | 4.9700 | 4.9530 | 4.9600 |
| S5 | 4.9640 | 4.9500 | 4.9530 | 4.9620 | 4.9560 |
| S6 | 4.9690 | 4.9510 | 4.9550 | 4.9660 | 4.9540 |
| S7 | 4.9600 | 4.9440 | 4.9570 | 4.9480 | 4.9510 |
| S8 | 4.9690 | 4.9490 | 4.9630 | 4.9520 | 4.9620 |
| S9 | 4.9840 | 4.9280 | 4.9600 | 4.9430 | 4.9550 |
| S10 | 4.9700 | 4.9340 | 4.9610 | 4.9400 | 4.9650 |
| S11 | 4.9750 | 4.9590 | 4.9620 | 4.9710 | 4.9680 |
| S12 | 4.9450 | 4.9770 | 4.9500 | 4.9690 | 4.9540 |
| S13 | 4.9760 | 4.9640 | 4.9700 | 4.9680 | 4.9720 |
| S14 | 4.9700 | 4.9540 | 4.9640 | 4.9590 | 4.9680 |
| S15 | 4.9820 | 4.9620 | 4.9680 | 4.9750 | 4.9630 |
Formulas used:
Let the range names be
| S1 | S2 | S3 | S4 | S5 | S6 | S7 | S8 | S9 | S10 | S11 | S12 | S13 | S14 | S15 |
And the formulas used for the average is:
=AVERAGE(S1), =AVERAGE(S2), and so on for fifteen samples.
Calculation:
We will apply the formula of the average in each of the samples to find out the result.
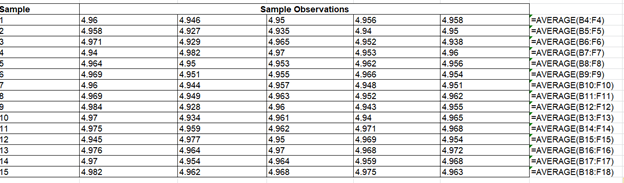
Thus, the outcome of the result is as follows:
| Sample | Sample Observations | Average | ||||
| 1 | 4.9600 | 4.9460 | 4.9500 | 4.9560 | 4.9580 | 4.9540 |
| 2 | 4.9580 | 4.9270 | 4.9350 | 4.9400 | 4.9500 | 4.9420 |
| 3 | 4.9710 | 4.9290 | 4.9650 | 4.9520 | 4.9380 | 4.9510 |
| 4 | 4.9400 | 4.9820 | 4.9700 | 4.9530 | 4.9600 | 4.9610 |
| 5 | 4.9640 | 4.9500 | 4.9530 | 4.9620 | 4.9560 | 4.9570 |
| 6 | 4.9690 | 4.9510 | 4.9550 | 4.9660 | 4.9540 | 4.9590 |
| 7 | 4.9600 | 4.9440 | 4.9570 | 4.9480 | 4.9510 | 4.9520 |
| 8 | 4.9690 | 4.9490 | 4.9630 | 4.9520 | 4.9620 | 4.9590 |
| 9 | 4.9840 | 4.9280 | 4.9600 | 4.9430 | 4.9550 | 4.9540 |
| 10 | 4.9700 | 4.9340 | 4.9610 | 4.9400 | 4.9650 | 4.9540 |
| 11 | 4.9750 | 4.9590 | 4.9620 | 4.9710 | 4.9680 | 4.9670 |
| 12 | 4.9450 | 4.9770 | 4.9500 | 4.9690 | 4.9540 | 4.9590 |
| 13 | 4.9760 | 4.9640 | 4.9700 | 4.9680 | 4.9720 | 4.9700 |
| 14 | 4.9700 | 4.9540 | 4.9640 | 4.9590 | 4.9680 | 4.9630 |
| 15 | 4.9820 | 4.9620 | 4.9680 | 4.9750 | 4.9630 | 4.9700 |
Want to see more full solutions like this?
Chapter 2 Solutions
Business Analytics


 Glencoe Algebra 1, Student Edition, 9780079039897...AlgebraISBN:9780079039897Author:CarterPublisher:McGraw Hill
 Big Ideas Math A Bridge To Success Algebra 1: Stu...AlgebraISBN:9781680331141Author:HOUGHTON MIFFLIN HARCOURTPublisher:Houghton Mifflin Harcourt
 College Algebra (MindTap Course List)AlgebraISBN:9781305652231Author:R. David Gustafson, Jeff HughesPublisher:Cengage Learning
 Holt Mcdougal Larson Pre-algebra: Student Edition...AlgebraISBN:9780547587776Author:HOLT MCDOUGALPublisher:HOLT MCDOUGAL