
Concept explainers
Videos
(a)
To find: the percentile where the IQ score is of 150
(a)
Answer to Problem 54E
An IQ score of 150 is approximately at the 95th percentile.
Explanation of Solution
Given:
Calculation:
Scores on the Wechsler adult Intelligence Scale (a standard IQ test) for the 20 to 34 age groupare approximately Normal with mean 110 and standard deviation 25.
That is
State: Let xbe the IQ scores of students. The variable x has a Normal distribution with
Plan: The proportion of IQ scores less than 150 is shown in the graph below:
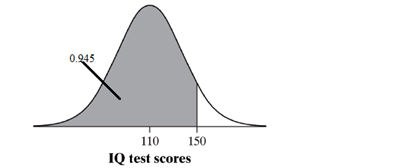
Do: For x =150, the corresponding z value is calculated as follows:
Using standard normal table, we can see that the proportion of observations less than 1.6 is 0.9452 or approximately 94.5%.
Conclude: An IQ score of 150 is approximately at the 95th percentile.
Conclusion:
Therefore, An IQ score of 150 is approximately at the 95th percentile.
(b)
To find: the percent of people aged 20 to 34 have IQs between 125 and 150
(b)
Answer to Problem 54E
Approximately 22% of people aged 20-34 have IQ scores between 12 and 150.
Explanation of Solution
Calculation:
State: Let x be the IQ scores of students. The variable x has a Normal distribution with
Plan: The proportion of IQ scores between 125 and 150 is shown in the graph below:
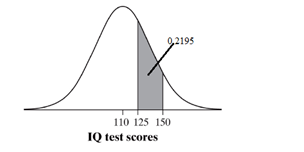
Do: From part (a) we have that for x = 150, the corresponding z - value = 1.6. For x =125, the corresponding z -value is calculated as follows:
So the proportion of observations between 0.6 and 1.6, is equal to the proportion of observations between 125 and 150.
Using standard normal table, the area between 0.6 and 1.6 is 0.9452 - 0.7257 =0.2195 or about 22%.
Conclude: Approximately 22% of people aged 20-34 have IQ scores between 12 and 150.
Conclusion:
Therefore, 22% of people aged 20-34 have IQ scores between 12 and 150.
(c)
To find: the scored to earn to qualify for MENSA membership
(c)
Answer to Problem 54E
In order to qualify for MENSA membership a person must score 162 or higher.
Explanation of Solution
Calculation:
State: Let xbe the IQ scores of students. The variable x has a Normal distribution with
Plan: The 98th percentile of the IQ scores is shown in the graph below:
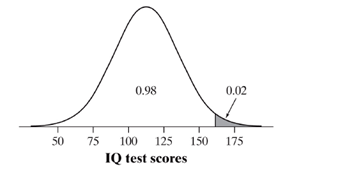
Do: From standard normal table, the 98" percentile for the standard Normal distribution is closest to 2.05. Therefore, the 98th percentile for the IQ scores can be found by solving the equation:
Conclude: In order to qualify for MENSA membership a person must score 162 or higher.
Conclusion:
Therefore, in order to qualify for MENSA membership a person must score 162 or higher.
Chapter 2 Solutions
The Practice of Statistics for AP - 4th Edition
Additional Math Textbook Solutions
Basic Business Statistics, Student Value Edition
An Introduction to Mathematical Statistics and Its Applications (6th Edition)
STATS:DATA+MODELS-W/DVD
Elementary Statistics: Picturing the World (6th Edition)
Elementary Statistics: Picturing the World (7th Edition)
Essentials of Statistics (6th Edition)


 MATLAB: An Introduction with ApplicationsStatisticsISBN:9781119256830Author:Amos GilatPublisher:John Wiley & Sons Inc
 Probability and Statistics for Engineering and th...StatisticsISBN:9781305251809Author:Jay L. DevorePublisher:Cengage Learning
 Statistics for The Behavioral Sciences (MindTap C...StatisticsISBN:9781305504912Author:Frederick J Gravetter, Larry B. WallnauPublisher:Cengage Learning
 Elementary Statistics: Picturing the World (7th E...StatisticsISBN:9780134683416Author:Ron Larson, Betsy FarberPublisher:PEARSON
 The Basic Practice of StatisticsStatisticsISBN:9781319042578Author:David S. Moore, William I. Notz, Michael A. FlignerPublisher:W. H. Freeman
 Introduction to the Practice of StatisticsStatisticsISBN:9781319013387Author:David S. Moore, George P. McCabe, Bruce A. CraigPublisher:W. H. Freeman