
Business Analytics
3rd Edition
ISBN: 9780135231715
Author: Evans
Publisher: PEARSON
expand_more
expand_more
format_list_bulleted
Question
Chapter 3, Problem 2PE
To determine
To create a line chart showing the growth in the annual CPI.
Expert Solution & Answer
Explanation of Solution
Given:
The Consumer price index excel file data is as follows:
| Consumer Price Index - All Urban Consumers | Bureau of Labor Statistics | |||||||||||
| Year | Jan | Feb | Mar | Apr | May | Jun | Jul | Aug | Sep | Oct | Nov | Dec |
| 2000 | 169.300 | 170.000 | 171.000 | 170.900 | 171.200 | 172.200 | 172.700 | 172.700 | 173.600 | 173.900 | 174.200 | 174.600 |
| 2001 | 175.600 | 176.000 | 176.100 | 176.400 | 177.300 | 177.700 | 177.400 | 177.400 | 178.100 | 177.600 | 177.500 | 177.400 |
| 2002 | 177.700 | 178.000 | 178.500 | 179.300 | 179.500 | 179.600 | 180.000 | 180.500 | 180.800 | 181.200 | 181.500 | 181.800 |
| 2003 | 182.600 | 183.600 | 183.900 | 183.200 | 182.900 | 183.100 | 183.700 | 184.500 | 185.100 | 184.900 | 185.000 | 185.500 |
| 2004 | 186.300 | 186.700 | 187.100 | 187.400 | 188.200 | 188.900 | 189.100 | 189.200 | 189.800 | 190.800 | 191.700 | 191.700 |
| 2005 | 191.600 | 192.400 | 193.100 | 193.700 | 193.600 | 193.700 | 194.900 | 196.1000 | 198.800 | 199.100 | 198.100 | 198.100 |
| 2006 | 199.200 | 199.400 | 199.700 | 200.600 | 201.400 | 201.900 | 202.900 | 203.700 | 202.900 | 201.800 | 202.000 | 203.100 |
| 2007 | 203.372 | 204.258 | 205.312 | 205.959 | 206.850 | 207.202 | 207.651 | 207.671 | 208.503 | 209.073 | 210.740 | 211.434 |
| 2008 | 212.225 | 212.703 | 213.543 | 214.106 | 215.287 | 217.279 | 219.102 | 218.779 | 218.846 | 216.832 | 212.923 | 211.339 |
| 2009 | 211.959 | 212.877 | 212.643 | 212.810 | 213.050 | 214.558 | 214.774 | 215.566 | 215.911 | 216.357 | 216.859 | 217.224 |
| 2010 | 217.587 | 217.591 | 217.729 | 217.579 | 217.224 | 216.929 | 217.597 | 218.150 | ||||
Calculation:
Since, we have to show the line chart for the growth in annual CPI. Thus, we have to take the sum of the months yearly basis. We will use the formula for sum, such as,
=SUM(number1,[number2],...])
Thus the result will be as:
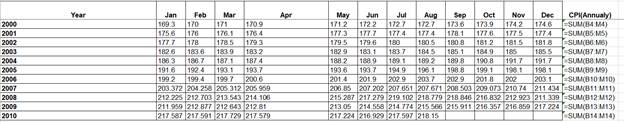
And the outcome will be:
| Year | Jan | Feb | Mar | Apr | May | Jun | Jul | Aug | Sep | Oct | Nov | Dec | CPI(Annualy) |
| 2000 | 169.300 | 170.000 | 171.000 | 170.900 | 171.200 | 172.200 | 172.700 | 172.700 | 173.600 | 173.900 | 174.200 | 174.600 | 2066.300 |
| 2001 | 175.600 | 176.000 | 176.100 | 176.400 | 177.300 | 177.700 | 177.400 | 177.400 | 178.100 | 177.600 | 177.500 | 177.400 | 2124.500 |
| 2002 | 177.700 | 178.000 | 178.500 | 179.300 | 179.500 | 179.600 | 180.000 | 180.500 | 180.800 | 181.200 | 181.500 | 181.800 | 2158.400 |
| 2003 | 182.600 | 183.600 | 183.900 | 183.200 | 182.900 | 183.100 | 183.700 | 184.500 | 185.100 | 184.900 | 185.000 | 185.500 | 2208.000 |
| 2004 | 186.300 | 186.700 | 187.100 | 187.400 | 188.200 | 188.900 | 189.100 | 189.200 | 189.800 | 190.800 | 191.700 | 191.700 | 2266.900 |
| 2005 | 191.600 | 192.400 | 193.100 | 193.700 | 193.600 | 193.700 | 194.900 | 196.1000 | 198.800 | 199.100 | 198.100 | 198.100 | 2343.200 |
| 2006 | 199.200 | 199.400 | 199.700 | 200.600 | 201.400 | 201.900 | 202.900 | 203.700 | 202.900 | 201.800 | 202.000 | 203.100 | 2418.600 |
| 2007 | 203.372 | 204.258 | 205.312 | 205.959 | 206.850 | 207.202 | 207.651 | 207.671 | 208.503 | 209.073 | 210.740 | 211.434 | 2488.025 |
| 2008 | 212.225 | 212.703 | 213.543 | 214.106 | 215.287 | 217.279 | 219.102 | 218.779 | 218.846 | 216.832 | 212.923 | 211.339 | 2582.964 |
| 2009 | 211.959 | 212.877 | 212.643 | 212.810 | 213.050 | 214.558 | 214.774 | 215.566 | 215.911 | 216.357 | 216.859 | 217.224 | 2574.588 |
| 2010 | 217.587 | 217.591 | 217.729 | 217.579 | 217.224 | 216.929 | 217.597 | 218.150 | 1740.386 |
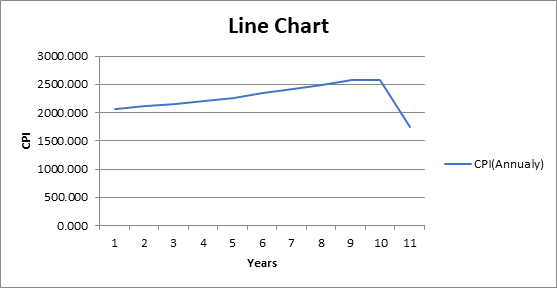
Then, we will construct the line chart by selecting the last column of CPI (annually) of the sums of the months year wise and then go to the insert button and then click on the line chart and the line chart is created,
The line chart is as follows:
Want to see more full solutions like this?
Subscribe now to access step-by-step solutions to millions of textbook problems written by subject matter experts!
Students have asked these similar questions
If the EPA sets a level of 0.08 as a maximum safe ozone level, what percent of the total number of days measured on the above graph exceed safe levels?
What is the predicted worldwide sales amount for e-cigarettes in 2010? Express your result in millions of dollars, rounded to the nearest whole number.
Estimate the price of one barrel of crude oil on January 12, 2015, and the rate at which it was rising on that day.
Chapter 3 Solutions
Business Analytics
Ch. 3 - Prob. 2PECh. 3 - Create a line chart for the closing prices for all...Ch. 3 - Create a pie chart showing the breakdown of...Ch. 3 - Create a stacked area chart contrasting primary...Ch. 3 - A national homebuilder builds single-family homes...Ch. 3 - The Excel file Facebook Survey provides data...Ch. 3 - Create a bubble chart for the first five colleges...Ch. 3 - Construct a column chart for the data in the Excel...Ch. 3 - The Excel file Internet Usage provides data about...Ch. 3 - Construct an appropriate chart to show the...
Ch. 3 - A marketing researcher surveyed 92 individuals,...Ch. 3 - In the Excel file Banking Data, apply the...Ch. 3 - Apply three different colors of data bars to...Ch. 3 - For the Store and Regional Sales database, apply a...Ch. 3 - For the Excel file Closing Stock Prices, apply...Ch. 3 - Create a useful dashboard for the data in the...Ch. 3 - Create a useful dashboard for the data in the...Ch. 3 - Create a useful dashboard for the data in the...
Knowledge Booster

Similar questions
- The Oxford Dictionary defines the word nominal asa value that is “stated or expressed but notnecessarily corresponding exactly to the real value.[18]Develop a reasonable argument for why the termnominal rate is used to describe the annual percentagerate of an investment account that compoundsinterest.arrow_forwardPerform a horizontal analysis for the entry "Gross Sales" shown on the income statement portion below. (Round percentages to one decimal place.) *Chart with the information is attached*arrow_forwardFind the 3 year period moving average for 2008arrow_forward
arrow_back_ios
arrow_forward_ios
Recommended textbooks for you
 College Algebra (MindTap Course List)AlgebraISBN:9781305652231Author:R. David Gustafson, Jeff HughesPublisher:Cengage Learning
 Glencoe Algebra 1, Student Edition, 9780079039897...AlgebraISBN:9780079039897Author:CarterPublisher:McGraw Hill
College Algebra (MindTap Course List)
Algebra
ISBN:9781305652231
Author:R. David Gustafson, Jeff Hughes
Publisher:Cengage Learning
Glencoe Algebra 1, Student Edition, 9780079039897...
Algebra
ISBN:9780079039897
Author:Carter
Publisher:McGraw Hill