
Concept explainers
Videos
To investigate:the relationship between breeding pairs and percent return.
Answer to Problem 13E
The overall pattern moves from upper left to lower right.
The form of the relationship is linear.
The relationship is moderately strong
Explanation of Solution
Given:
| Breeding pairs: | Percent return: |
Follow the four-step process.
Calculation:
Using Excel, the scatter plot for the given data is shown below:
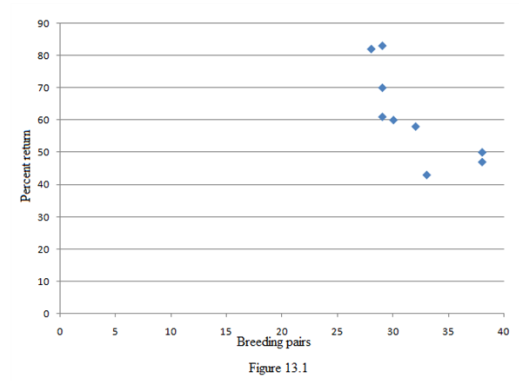
From the above figure the overall pattern moves from upper left to lower right. That is, lower percent return tends to have higher breeding pairs. We call this a negative association between the two variables. The form of the relationship is linear. That is, the overall pattern follows a straight line from upper left to lower right. The relationship is moderately strong because the points don’t deviate greatly from line but there is one outlier (lower right).
If the number of breeding pairs in an isolated area is higher, lower the percent of males (branded for identification) that returned the next breeding season.
Conclusion:
The overall pattern moves from upper left to lower right.
The form of the relationship is linear.
The relationship is moderately strong
Chapter 3 Solutions
The Practice of Statistics for AP - 4th Edition
Additional Math Textbook Solutions
An Introduction to Mathematical Statistics and Its Applications (6th Edition)
Basic Business Statistics, Student Value Edition (13th Edition)
Introductory Statistics
Fundamentals of Statistics (5th Edition)
Statistics for Business and Economics (13th Edition)
Elementary Statistics Using Excel (6th Edition)


 MATLAB: An Introduction with ApplicationsStatisticsISBN:9781119256830Author:Amos GilatPublisher:John Wiley & Sons Inc
 Probability and Statistics for Engineering and th...StatisticsISBN:9781305251809Author:Jay L. DevorePublisher:Cengage Learning
 Statistics for The Behavioral Sciences (MindTap C...StatisticsISBN:9781305504912Author:Frederick J Gravetter, Larry B. WallnauPublisher:Cengage Learning
 Elementary Statistics: Picturing the World (7th E...StatisticsISBN:9780134683416Author:Ron Larson, Betsy FarberPublisher:PEARSON
 The Basic Practice of StatisticsStatisticsISBN:9781319042578Author:David S. Moore, William I. Notz, Michael A. FlignerPublisher:W. H. Freeman
 Introduction to the Practice of StatisticsStatisticsISBN:9781319013387Author:David S. Moore, George P. McCabe, Bruce A. CraigPublisher:W. H. Freeman