
Concept explainers
Videos
(a)
To make:a
(a)
Answer to Problem 9E
Explanation of Solution
Given
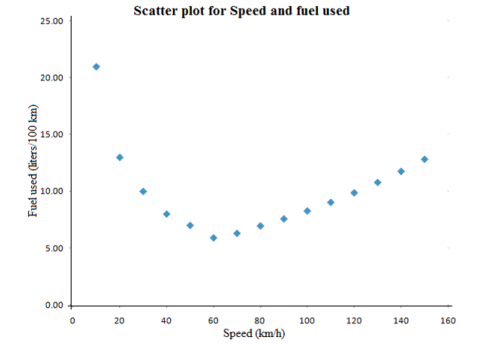
| Speed(km/h) | Fuel used(liters/ km) | Speed (km/h) | Fuel used(liters/ km) |
Calculation:
We put speed (the explanatory variable) on the horizontal axis and fuel used (the response variable) on the vertical axis, Figure

Conclusion:
Therefore, the required scatterplot is drawn.
(b)
To describe: the form of the relationship and explain why it is not linear
(b)
Answer to Problem 9E
The form of the relationship is slightly curved. Most states fall into one of two distinct clusters
Explanation of Solution
The form of the relationship is slightly curved. It does not mean that two variables are not related but it means that two variables are not linearly related. More important, most states fall into one of two distinct clusters. In about
(c)
To explain: why the variables are not either positively associated or negatively associated
(c)
Answer to Problem 9E
Since the relationship is curved not linear, it does not make sense to describe the variables as either positively associated or negatively associated.
Explanation of Solution
Since the relationship is curved not linear, it does not make sense to describe the variables as either positively associated or negatively associated. Positive and negative association works only when variables are linearly related.
(d)
To explain: whether the relationship is strong or quite weak
(d)
Answer to Problem 9E
If data is broke into two parts, then the relationship is very strong If whole data is taken at once and fit it in linear relation then it is weak relationship because overall pattern does not follow a straight line.
Explanation of Solution
If data is broke into two parts,
Chapter 3 Solutions
The Practice of Statistics for AP - 4th Edition
Additional Math Textbook Solutions
STATS:DATA+MODELS-W/DVD
Intro Stats
Fundamentals of Statistics (5th Edition)
Essentials of Statistics, Books a la Carte Edition (5th Edition)
Introductory Statistics (10th Edition)


 MATLAB: An Introduction with ApplicationsStatisticsISBN:9781119256830Author:Amos GilatPublisher:John Wiley & Sons Inc
 Probability and Statistics for Engineering and th...StatisticsISBN:9781305251809Author:Jay L. DevorePublisher:Cengage Learning
 Statistics for The Behavioral Sciences (MindTap C...StatisticsISBN:9781305504912Author:Frederick J Gravetter, Larry B. WallnauPublisher:Cengage Learning
 Elementary Statistics: Picturing the World (7th E...StatisticsISBN:9780134683416Author:Ron Larson, Betsy FarberPublisher:PEARSON
 The Basic Practice of StatisticsStatisticsISBN:9781319042578Author:David S. Moore, William I. Notz, Michael A. FlignerPublisher:W. H. Freeman
 Introduction to the Practice of StatisticsStatisticsISBN:9781319013387Author:David S. Moore, George P. McCabe, Bruce A. CraigPublisher:W. H. Freeman