Developmental Mathematics (9th Edition)
9th Edition
ISBN: 9780321997173
Author: Marvin L. Bittinger, Judith A. Beecher
Publisher: PEARSON
expand_more
expand_more
format_list_bulleted
Concept explainers
Videos
Question
Chapter 5.2, Problem 11DE
To determine
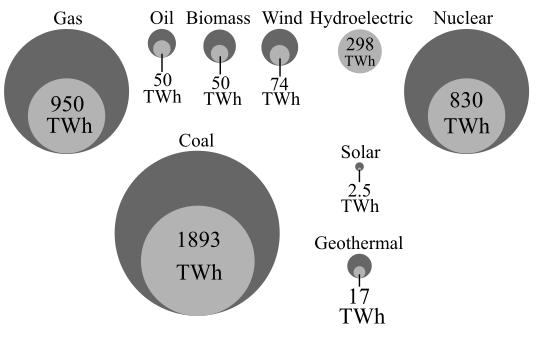
To calculate: The amount of electricity generated from the renewable resources which are solar, geothermal, hydroelectric and wind using the graph when the graph that shows the various method to generated electricity in U.S. in which the yellow circle represents the amount of electricity generated from different sources in terawatt-hours per year (TWh) and the larger circle surrounding yellow circle represents the electricity that could have been generated if the method were 100% efficient.
Expert Solution & Answer
Want to see the full answer?
Check out a sample textbook solution
Students have asked these similar questions
For Exercises 33–38, find the exact value of each expression without the use of a calculator. (See Example 5)
Give me explanations and answers for numbers 3 and 5.
In Exercises 1–14, use intercepts and a checkpoint to graph each linear function.
Use this information to solve Exercises 9–11:A company is
planning to produce and sell a new line of computers. The fixed
cost will be $360,000 and it will cost $850 to produce each
computer. Each computer will be sold for $1150.
9. Write the cost function, C, of producing x computers.
10. Write the revenue function, R, from the sale of
x computers.
11. Determine the break-even point. Describe what this
means.
Chapter 5 Solutions
Developmental Mathematics (9th Edition)
Ch. 5.1 - Objectives 1.6c and 3.4c:Simplify expressions...Ch. 5.1 - Prob. 2SRCh. 5.1 - Prob. 1DECh. 5.1 - Prob. 2DECh. 5.1 - Prob. 3DECh. 5.1 - Prob. 4DECh. 5.1 - GS Sohas sociology professor included the...Ch. 5.1 - Prob. 6DECh. 5.1 - Prob. 7DECh. 5.1 - Prob. 8DE
Ch. 5.1 - Prob. 9DECh. 5.1 - Prob. 10DECh. 5.1 - Prob. 11DECh. 5.1 - Prob. 12DECh. 5.1 - Prob. 13DECh. 5.1 - Prob. 14DECh. 5.1 - Prob. 15DECh. 5.1 - 16. In a lab, Gina determined the mass, in grams,...Ch. 5.1 - Prob. 1RCCh. 5.1 - Prob. 2RCCh. 5.1 - Prob. 3RCCh. 5.1 - Prob. 4RCCh. 5.1 - Prob. 1ESCh. 5.1 - Prob. 2ESCh. 5.1 - Prob. 3ESCh. 5.1 - Prob. 4ESCh. 5.1 - Prob. 5ESCh. 5.1 - Prob. 6ESCh. 5.1 - Prob. 7ESCh. 5.1 - Prob. 8ESCh. 5.1 - Prob. 9ESCh. 5.1 - Prob. 10ESCh. 5.1 - Prob. 11ESCh. 5.1 - Prob. 12ESCh. 5.1 - Prob. 13ESCh. 5.1 - Prob. 14ESCh. 5.1 - Prob. 15ESCh. 5.1 - Prob. 16ESCh. 5.1 - Grading. To get a B in math, Rich must score an...Ch. 5.1 - Prob. 18ESCh. 5.1 - Prob. 19ESCh. 5.1 - Prob. 20ESCh. 5.1 - Median Home Prices. The following table lists the...Ch. 5.1 - Prob. 22ESCh. 5.1 - Movie Ticket Sales. The following table lists the...Ch. 5.1 - Prob. 24ESCh. 5.1 - Prob. 25ESCh. 5.1 - Prob. 26ESCh. 5.1 - Prob. 27ESCh. 5.1 - Prob. 28ESCh. 5.1 - Prob. 29ESCh. 5.1 - Prob. 30ESCh. 5.1 - Prob. 31ESCh. 5.2 - Objective 2.4d: Multiply using mixed numerals....Ch. 5.2 - Prob. 2SRCh. 5.2 - Use the table in Example 1 to answer Margin...Ch. 5.2 - Prob. 2DECh. 5.2 - Prob. 3DECh. 5.2 - Prob. 4DECh. 5.2 - Prob. 5DECh. 5.2 - Prob. 6DECh. 5.2 - Prob. 7DECh. 5.2 - Prob. 8DECh. 5.2 - Prob. 9DECh. 5.2 - Prob. 10DECh. 5.2 - Prob. 11DECh. 5.2 - Prob. 12DECh. 5.2 - Prob. 13DECh. 5.2 - Prob. 14DECh. 5.2 - Prob. 15DECh. 5.2 - Prob. 1RCCh. 5.2 - Prob. 2RCCh. 5.2 - Prob. 3RCCh. 5.2 - Prob. 4RCCh. 5.2 - Prob. 1ESCh. 5.2 - Prob. 2ESCh. 5.2 - Prob. 3ESCh. 5.2 - Prob. 4ESCh. 5.2 - Prob. 5ESCh. 5.2 - Prob. 6ESCh. 5.2 - Prob. 7ESCh. 5.2 - Prob. 8ESCh. 5.2 - Prob. 9ESCh. 5.2 - Prob. 10ESCh. 5.2 - Prob. 11ESCh. 5.2 - Prob. 12ESCh. 5.2 - Prob. 13ESCh. 5.2 - Prob. 14ESCh. 5.2 - Prob. 15ESCh. 5.2 - Prob. 16ESCh. 5.2 - Prob. 17ESCh. 5.2 - Prob. 18ESCh. 5.2 - Prob. 19ESCh. 5.2 - Prob. 20ESCh. 5.2 - Prob. 21ESCh. 5.2 - Prob. 22ESCh. 5.2 - Prob. 23ESCh. 5.2 - Prob. 24ESCh. 5.2 - Prob. 25ESCh. 5.2 - Prob. 26ESCh. 5.2 - Prob. 27ESCh. 5.2 - Prob. 28ESCh. 5.2 - Prob. 29ESCh. 5.2 - Prob. 30ESCh. 5.2 - Prob. 31ESCh. 5.2 - Prob. 32ESCh. 5.2 - Prob. 33ESCh. 5.2 - Prob. 34ESCh. 5.2 - Prob. 35ESCh. 5.2 - Prob. 36ESCh. 5.2 - Prob. 37ESCh. 5.2 - Prob. 38ESCh. 5.2 - Personal Consumption Expenditures. The following...Ch. 5.2 - Personal Consumption Expenditures. The following...Ch. 5.2 - Prob. 41ESCh. 5.2 - Prob. 42ESCh. 5.2 - Prob. 43ESCh. 5.2 - Prob. 44ESCh. 5.2 - Prob. 1MCRCh. 5.2 - Prob. 2MCRCh. 5.2 - Prob. 3MCRCh. 5.2 - Prob. 4MCRCh. 5.2 - Prob. 5MCRCh. 5.2 - Prob. 6MCRCh. 5.2 - Prob. 7MCRCh. 5.2 - Prob. 8MCRCh. 5.2 - Prob. 9MCRCh. 5.2 - Prob. 10MCRCh. 5.2 - Prob. 11MCRCh. 5.2 - Prob. 12MCRCh. 5.2 - Prob. 13MCRCh. 5.2 - Prob. 14MCRCh. 5.2 - Prob. 15MCRCh. 5.2 - Prob. 16MCRCh. 5.2 - Downsizing. Companies sometimes downsize their...Ch. 5.2 - Prob. 18MCRCh. 5.2 - Prob. 19MCRCh. 5.2 - Prob. 20MCRCh. 5.2 - Prob. 21MCRCh. 5.2 - Prob. 22MCRCh. 5.2 - Prob. 23UTDWCh. 5.2 - Answers to Exercises 23 and 24 can be found on...Ch. 5.3 - Objective 3.1c: Given a pair of numbers in decimal...Ch. 5.3 - Objective 3.1c: Given a pair of numbers in decimal...Ch. 5.3 - Prob. 1DECh. 5.3 - Prob. 2DECh. 5.3 - Prob. 3DECh. 5.3 - Prob. 4DECh. 5.3 - Prob. 5DECh. 5.3 - Prob. 6DECh. 5.3 - Prob. 7DECh. 5.3 - Prob. 8DECh. 5.3 - Prob. 1RCCh. 5.3 - Prob. 2RCCh. 5.3 - Prob. 3RCCh. 5.3 - Prob. 4RCCh. 5.3 - Prob. 1ESCh. 5.3 - Prob. 2ESCh. 5.3 - Prob. 3ESCh. 5.3 - Prob. 4ESCh. 5.3 - Prob. 5ESCh. 5.3 - Prob. 6ESCh. 5.3 - Prob. 7ESCh. 5.3 - Prob. 8ESCh. 5.3 - Prob. 9ESCh. 5.3 - Prob. 10ESCh. 5.3 - Prob. 11ESCh. 5.3 - Prob. 12ESCh. 5.3 - Prob. 13ESCh. 5.3 - Prob. 14ESCh. 5.3 - Prob. 15ESCh. 5.3 - Prob. 16ESCh. 5.3 - Prob. 17ESCh. 5.3 - Prob. 18ESCh. 5.3 - Prob. 19ESCh. 5.3 - Prob. 20ESCh. 5.3 - Prob. 21ESCh. 5.3 - Prob. 22ESCh. 5.3 - Prob. 23ESCh. 5.3 - Prob. 24ESCh. 5.3 - Prob. 25ESCh. 5.3 - Prob. 26ESCh. 5.3 - Prob. 27ESCh. 5.3 - Prob. 28ESCh. 5.3 - Prob. 29ESCh. 5.3 - Prob. 30ESCh. 5.3 - Prob. 31ESCh. 5.3 - Prob. 32ESCh. 5.3 - Prob. 33ESCh. 5.3 - Prob. 34ESCh. 5.3 - Prob. 35ESCh. 5.3 - Prob. 36ESCh. 5.3 - Prob. 37ESCh. 5.3 - Prob. 38ESCh. 5.3 - Prob. 39ESCh. 5.3 - Prob. 40ESCh. 5.3 - Prob. 41ESCh. 5.3 - Prob. 42ESCh. 5.3 - Prob. 43ESCh. 5.3 - Prob. 44ESCh. 5.3 - Prob. 45ESCh. 5.3 - Prob. 46ESCh. 5.3 - Prob. 47ESCh. 5.3 - Prob. 48ESCh. 5.3 - Prob. 49ESCh. 5.3 - Prob. 50ESCh. 5.3 - Prob. 51ESCh. 5.3 - Prob. 52ESCh. 5.3 - Prob. 53ESCh. 5.3 - Prob. 54ESCh. 5.3 - Prob. 55ESCh. 5.3 - Prob. 56ESCh. 5.3 - Prob. 57ESCh. 5.3 - Prob. 58ESCh. 5.3 - Prob. 59ESCh. 5.3 - Prob. 60ESCh. 5.4 - Objective 4.3a: Convert from fraction notation to...Ch. 5.4 - Prob. 2SRCh. 5.4 - Prob. 1DECh. 5.4 - Prob. 2DECh. 5.4 - Prob. 3DECh. 5.4 - Prob. 4DECh. 5.4 - Prob. 1TFSCh. 5.4 - Prob. 2TFSCh. 5.4 - Prob. 3TFSCh. 5.4 - Prob. 4TFSCh. 5.4 - Prob. 5TFSCh. 5.4 - The goal of these matching questions is to...Ch. 5.4 - Prob. 7TFSCh. 5.4 - Prob. 8TFSCh. 5.4 - Prob. 9TFSCh. 5.4 - Prob. 10TFSCh. 5.4 - Prob. 1RCCh. 5.4 - Prob. 2RCCh. 5.4 - Prob. 3RCCh. 5.4 - Prob. 4RCCh. 5.4 - Prob. 5RCCh. 5.4 - Prob. 6RCCh. 5.4 - Prob. 1ESCh. 5.4 - Prob. 2ESCh. 5.4 - Prob. 3ESCh. 5.4 - Prob. 4ESCh. 5.4 - Prob. 5ESCh. 5.4 - Prob. 6ESCh. 5.4 - Prob. 7ESCh. 5.4 - Prob. 8ESCh. 5.4 - Prob. 9ESCh. 5.4 - Prob. 10ESCh. 5 - Complete each statement with the correct term from...Ch. 5 - Prob. 2VRCh. 5 - Prob. 3VRCh. 5 - Prob. 4VRCh. 5 - Prob. 5VRCh. 5 - Prob. 6VRCh. 5 - Prob. 1CORCh. 5 - Prob. 2CORCh. 5 - Prob. 3CORCh. 5 - Prob. 1SGPECh. 5 - 2. Use the table in the example shown above for...Ch. 5 - Which oatmeal has the greatest cost per serving?...Ch. 5 - Prob. 4SGPECh. 5 - Prob. 5SGPECh. 5 - Prob. 6SGPECh. 5 - Use the circle graph at left to answer Exercises 7...Ch. 5 - Use the circle graph at left to answer Exercises 7...Ch. 5 - Prob. 1RECh. 5 - Prob. 2RECh. 5 - Prob. 3RECh. 5 - Prob. 4RECh. 5 - Prob. 5RECh. 5 - Prob. 6RECh. 5 - Prob. 7RECh. 5 - Gas Mileage. A 2012 Mazda Miata does 336 mi of...Ch. 5 - Prob. 9RECh. 5 - Prob. 10RECh. 5 - Prob. 11RECh. 5 - Prob. 12RECh. 5 - Prob. 13RECh. 5 - Prob. 14RECh. 5 - Prob. 15RECh. 5 - Prob. 16RECh. 5 - Prob. 17RECh. 5 - Prob. 18RECh. 5 - Prob. 19RECh. 5 - Prob. 20RECh. 5 - Prob. 21RECh. 5 - Prob. 22RECh. 5 - Prob. 23RECh. 5 - Prob. 24RECh. 5 - Prob. 25RECh. 5 - Prob. 26RECh. 5 - Major League World Series. Except for four years,...Ch. 5 - Prob. 28RECh. 5 - Prob. 29RECh. 5 - Prob. 30RECh. 5 - Prob. 31RECh. 5 - Prob. 32RECh. 5 - Prob. 33RECh. 5 - Prob. 34RECh. 5 - Prob. 35RECh. 5 - Prob. 36RECh. 5 - Prob. 37RECh. 5 - Prob. 38RECh. 5 - Prob. 39RECh. 5 - Prob. 40RECh. 5 - Prob. 41RECh. 5 - Prob. 42RECh. 5 - Prob. 43RECh. 5 - Prob. 44RECh. 5 - Prob. 45RECh. 5 - What is the average of this set of data?...Ch. 5 - Prob. 47RECh. 5 - Prob. 48RECh. 5 - Prob. 49RECh. 5 - Prob. 50RECh. 5 - Prob. 1UTDWCh. 5 - Prob. 2UTDWCh. 5 - Prob. 3UTDWCh. 5 - Prob. 4UTDWCh. 5 - Prob. 5UTDWCh. 5 - Prob. 6UTDWCh. 5 - Prob. 1TCh. 5 - Prob. 2TCh. 5 - Prob. 3TCh. 5 - Prob. 4TCh. 5 - Prob. 5TCh. 5 - Prob. 6TCh. 5 - Prob. 7TCh. 5 - Prob. 8TCh. 5 - Prob. 9TCh. 5 - Prob. 10TCh. 5 - Prob. 11TCh. 5 - Prob. 12TCh. 5 - Prob. 13TCh. 5 - Prob. 14TCh. 5 - Prob. 15TCh. 5 - Prob. 16TCh. 5 - Prob. 17TCh. 5 - Prob. 18TCh. 5 - Prob. 19TCh. 5 - Prob. 20TCh. 5 - Prob. 21TCh. 5 - Prob. 22TCh. 5 - Prob. 23TCh. 5 - Prob. 24TCh. 5 - Prob. 25TCh. 5 - 26. Referring to Exercise 25, consider a family...
Knowledge Booster


Learn more about
Need a deep-dive on the concept behind this application? Look no further. Learn more about this topic, subject and related others by exploring similar questions and additional content below.Similar questions
- Exercises 93–94: Energy The following graph shows U.S. Energy consumption. 400 350 300 250 200 150 100 50 04 1970 1990 2010 Year 93. When was energy consumption increasing? 94. When was energy consumption decreasing? Energy (millions of Btu)arrow_forwardEXERCISE 1.2arrow_forwardThe figure shows the graphs of the cost and revenue functions for a company that manufactures and sells small radios. Use the information in the figure to solve Exercises 67–72. 35,000 30,000 C(x) = 10,000 + 30x 25,000 20,000 15,000 R(x) = 50x 10,000 5000 100 200 300 400 500 600 700 Radios Produced and Sold 67. How many radios must be produced and sold for the company to break even? 68. More than how many radios must be produced and sold for the company to have a profit? 69. Use the formulas shown in the voice balloons to find R(200) – C(200). Describe what this means for the company. 70. Use the formulas shown in the voice balloons to find R(300) – C(300). Describe what this means for the company. 71. a. Use the formulas shown in the voice balloons to write the company's profit function, P, from producing and selling x radios. b. Find the company's profit if 10,000 radios are produced and sold. 72. a. Use the formulas shown in the voice balloons to write the company's profit function,…arrow_forward
- Insurance Rates The following table gives themonthly insurance rates for a $100,000 life insurancepolicy for smokers 35–50 years of age.a. Create a scatter plot for the data.b. Does it appear that a quadratic function can beused to model the data? If so, find the best-fittingquadratic model.c. Find the power model that is the best fit for the data.d. Compare the two models by graphing each modelon the same axes with the data points. Whichmodel appears to be the better fit?arrow_forwardWorld Military Expenditure The following chart shows total military and arms trade expenditure from 2011–2020 (t = 1 represents 2011). †A bar graph titled "World military expenditure" has a horizontal t-axis labeled "Year since 2010" and a vertical axis labeled "$ (billions)". The bar graph has 10 bars. Each bar is associated with a label and an approximate value as listed below. 1: 1,800 billion dollars 2: 1,775 billion dollars 3: 1,750 billion dollars 4: 1,730 billion dollars 5: 1,760 billion dollars 6: 1,760 billion dollars 7: 1,850 billion dollars 8: 1,900 billion dollars 9: 1,950 billion dollars 10: 1,980 billion dollars (a) If you want to model the expenditure figures with a function of the form f(t) = at2 + bt + c, would you expect the coefficient a to be positive or negative? Why? HINT [See "Features of a Parabola" in this section.] We would expect the coefficient to be positive because the curve is concave up. We would expect the coefficient to be negative because the…arrow_forwardFinish exercise 2.2.7 Thank youarrow_forward
- Use Graphs A-D for Exercises 9–11. During the winter, the amount of water that flows down a river remains at a low constant. In the spring, when the snow melts, the flow of water increases drastically, until it decreases to a steady rate in the summer. The flow then slowly decreases through the fall into the winter. Consider the graphs shown. А. В. Season (winter-fall) Season (winter-fall) Season (winter-fall) Season (winter-fall) 9. Which graph best represents the given situation? 10. Describe the other three graphs. 11. What are possible situations for graphs B, C, and D? Lesson 1 111 Water (gallons per second) Water (gallons per second) D. Water (gallons per second) Water (gallons per second)arrow_forwardAmerica is getting older. The graph shows the projected elderly U.S. population for ages 65–84 and for ages 85 and older.The formula E = 5.8√x + 56.4 models the projected number of elderly Americans ages 65–84, E, in millions, x years after 2020.a. Use the formula to find the projected increase in the number of Americans ages 65–84, in millions, from 2030 to 2060. Express this difference in simplified radicalform.b. Use a calculator and write your answer in part (a) to the nearest tenth. Does this rounded decimal overestimate or underestimate the difference in the projected data shown by the bar graph ? By how much?arrow_forwardIn Exercises 65–68, find and sketch the domain of ƒ. Then find an equation for the level curve or surface of the function passing through the given point.arrow_forward
arrow_back_ios
SEE MORE QUESTIONS
arrow_forward_ios
Recommended textbooks for you
 Algebra & Trigonometry with Analytic GeometryAlgebraISBN:9781133382119Author:SwokowskiPublisher:Cengage
Algebra & Trigonometry with Analytic Geometry
Algebra
ISBN:9781133382119
Author:Swokowski
Publisher:Cengage
Which is the best chart: Selecting among 14 types of charts Part II; Author: 365 Data Science;https://www.youtube.com/watch?v=qGaIB-bRn-A;License: Standard YouTube License, CC-BY