
Concept explainers
Videos
Contribution margin, break-even sales, cost-volume-profit chart, margin of safety, and operating leverage
Belmain Co. expects to maintain the same inventories at the end of 20Y7 as at the beginning of the year. The total of all production costs for the year is therefore assumed to be equal to the cost of goods sold. With this in mind, the various department heads were asked to submit estimates of the costs for their departments during the year. A summary report of these estimates is as follows:

It is expected that 12,000 units will be sold at a price of $240 a unit. Maximum sales within the relevant range are 18,000 units.
Instructions
- 1. Prepare an estimated income statement for 20Y7.
- 2. What is the expected contribution margin ratio?
- 3. Determine the break-even sales in units and dollars.
- 4. Construct a cost-volume-profit chart indicating the break-even sales.
- 5. What is the expected margin of safety in dollars and as a percentage of sales? (Round to one decimal place.)
- 6. Determine the operating leverage.
1.
Prepare an estimated income statement for 20Y7.
Explanation of Solution
Cost-Volume-Profit Analysis: It is a method followed to analyze the relationship between the sales, costs, and the related profit or loss at various levels of units sold. In other words, it shows the effect of the changes in the cost and the sales volume on the operating income of the company.
Prepare an estimated income statement for 20Y7.
| Company B | |||
| Estimated Income Statement | |||
| For the year ended December 31, 20Y8 | |||
| Particulars | Amount ($) | Amount ($) | Amount ($) |
| Sales (1) | 2,880,000 | ||
| Less: Cost of Goods sold: | |||
| Direct Materials (2) | 600,000 | ||
| Direct Labor (3) | 360,000 | ||
| Factory Overhead (4) | 422,000 | ||
| Cost of Goods Sold | (1,382,000) | ||
| Gross Profit | 1,498,000 | ||
| Less: Expenses: | |||
| Selling expenses: | |||
| Sales salaries and commissions (5) | 388,000 | ||
| Advertising | 116,000 | ||
| Travel | 4,000 | ||
| Miscellaneous selling expense (6) | 14,300 | ||
| Total selling expenses | 522,300 | ||
| Administrative expenses: | |||
| Office and Officers’ salaries | 325,000 | ||
| Supplies (7) | 54,000 | ||
| Miscellaneous administrative expenses (8) | 20,700 | ||
| Total administrative expenses | 399,700 | ||
| Total expenses | (922,000) | ||
| Income from operations | 576,000 | ||
Table (1)
Working note (1):
Determine sales.
Number of units to be sold =12,000 units
Selling price per unit =$240 per unit
Working note (2):
Determine the cost of direct materials.
Number of units to be sold =12,000 units
Direct Materials cost per unit =$50 per unit
Working note (3):
Determine the cost of direct labor.
Number of units to be sold =12,000 units
Direct labor cost per unit =$30 per unit
Working note (4):
Determine the cost of factory overhead.
Factory overhead-Fixed =$350,000
Number of units to be sold =12,000 units
Factory overhead-Variable cost per unit =$6 per unit
Working note (5):
Determine the sales salaries and commissions.
Sales salaries and commissions-Fixed =$340,000
Number of units to be sold =12,000 units
Sales salaries and commissions-Variable cost per unit =$4 per unit
Working note (6):
Determine the miscellaneous selling expense.
Miscellaneous selling expense-Fixed =$2,300
Number of units to be sold =12,000 units
Miscellaneous selling expense-Variable cost per unit =$1 per unit
Working note (7):
Determine the supplies.
Supplies-Fixed =$6,000
Number of units to be sold =12,000 units
Supplies-Variable cost per unit =$4 per unit
Working note (8):
Determine the miscellaneous administrative expense.
Miscellaneous administrative expense-Fixed =$8,700
Number of units to be sold =12,000 units
Miscellaneous administrative expense-Variable cost per unit =$1 per unit
2.
Calculate the expected contribution margin ratio.
Explanation of Solution
Determine the expected contribution margin ratio.
Sales =$2,880,000 (1)
Variable cost =$1,152,000 (9)
Working note (9):
Determine the variable cost.
Number of units to be sold =12,000 units
Variable cost per unit =$96 per unit
Therefore, the expected contribution margin ratio is 60%.
3.
Calculate the break-even sales in units and dollars.
Explanation of Solution
Determine the break-even sales in units.
Fixed cost =$1,152,000
Contribution margin per unit =$144 per unit (10)
Working note (10):
Compute the contribution margin per unit.
Selling price per unit =$240 per unit
Variable cost per unit =$96 per unit
Determine the break-even sales in dollars.
Fixed cost =$1,152,000
Contribution margin ratio =60% (refer Part 2)
Therefore, the break-even sales in units is 8,000 units and dollars is $1,920,000.
4.
Construct a cost-volume-profit chart indicating the break-even sales.
Explanation of Solution
Construct a cost-volume-profit chart indicating the break-even sales.
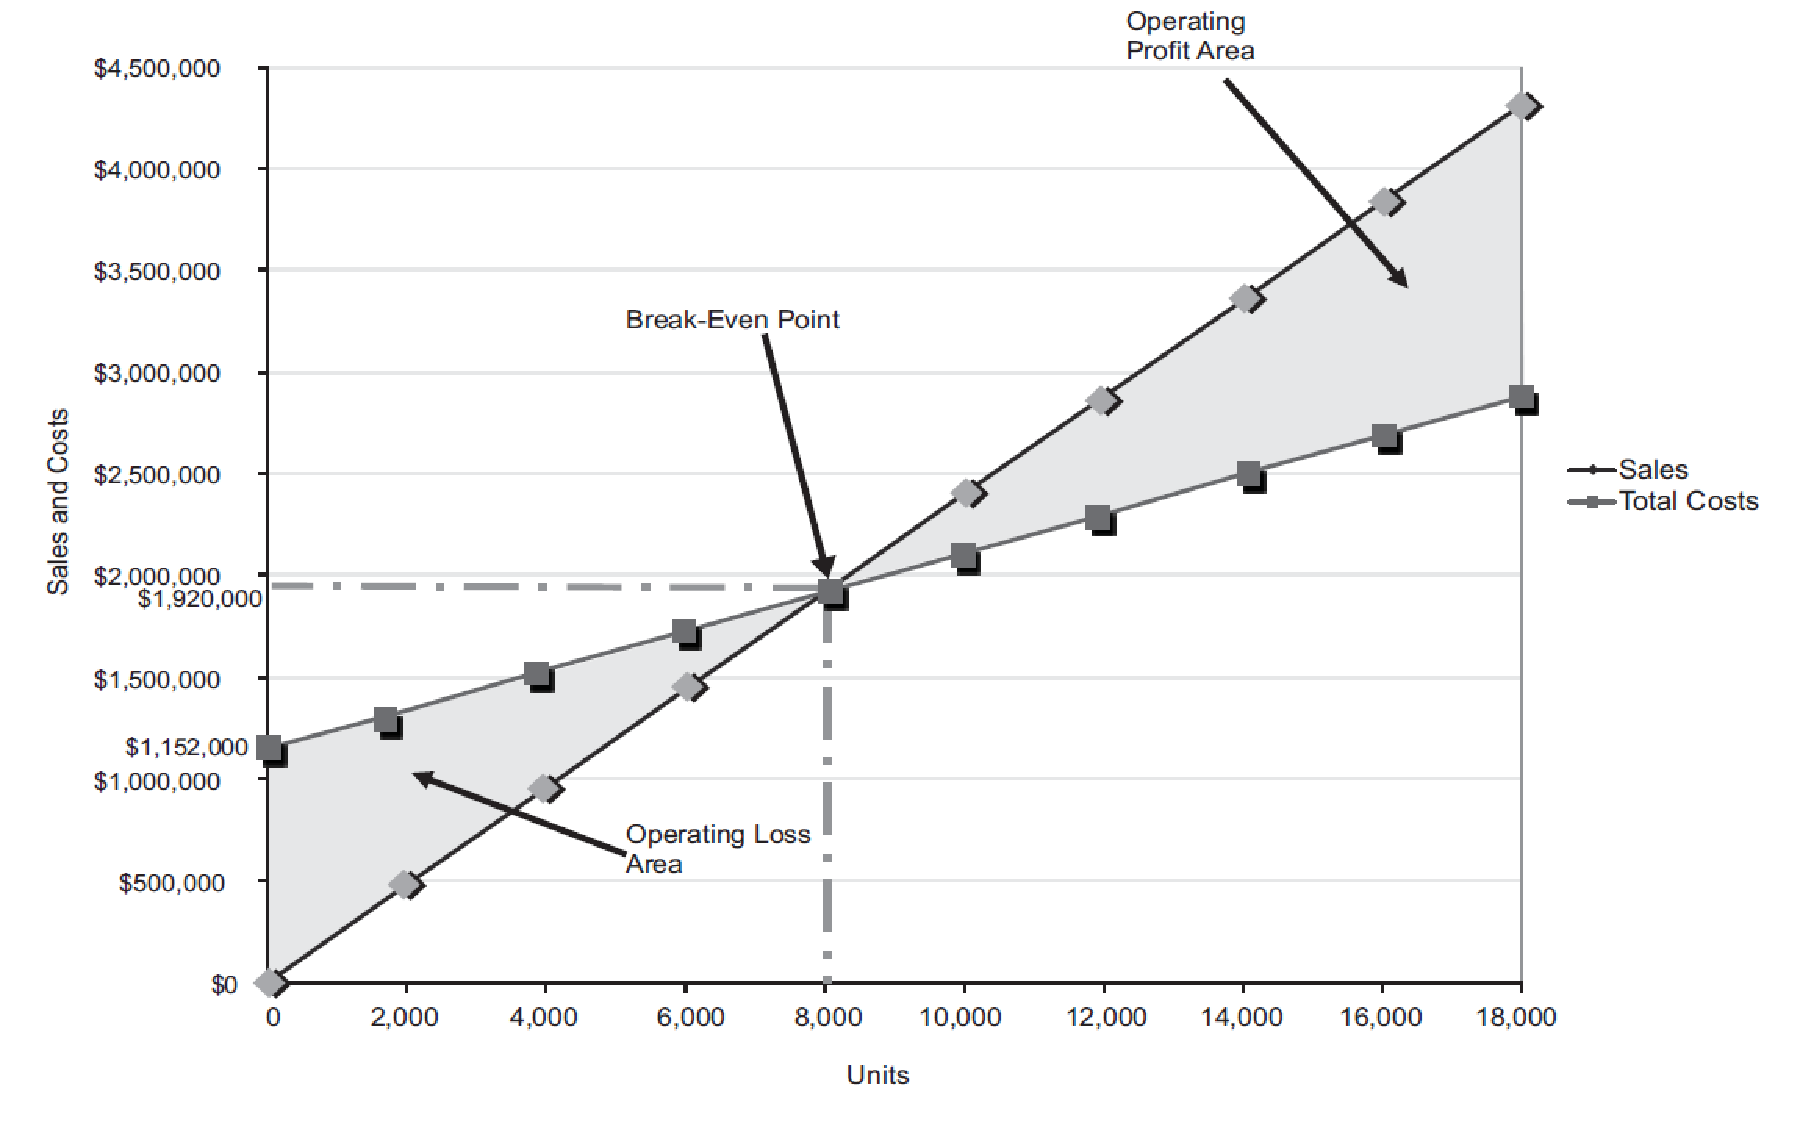
Figure (1)
The volume in units of sales is shown on the horizontal axis. The maximum relevant range is 18,000 units. The sales and the total costs (fixed cost and variable cost) in dollars is shown on the vertical axis. The maximum relevant range of sales and total costs is $4,500,000.
The total sales line is drawn right upward by connecting the first point at $0 to the second point at $4,320,000
The total cost line is drawn right upward by connecting the first point at $1,152,000 (fixed cost) on the vertical axis to the second point at
The break-even point is the intersection point where the total sales line and total cost line meet. The vertical dotted line drawn downward from the intersection point reaches at 8,000 units. It indicates the break-even sales (units). The horizontal line drawn to the left towards the vertical axis reaches at $1,920,000. It indicates the break-even sales (dollars). Refer Part 3 for the break-even values.
The operating profit area is the area where the total sales line exceeds the total cost line. However, the operating loss area is the area where the total cost exceeds the total sales line.
5.
Calculate the expected margin of safety in dollars and as a percentage of sales.
Explanation of Solution
Determine the expected margin of safety in dollars.
Sales =$2,880,000 (1)
Sales at break-even point =$1,920,000 (refer Part 3)
Determine the expected margin of safety as a percentage of sales.
Sales =$2,880,000 (1)
Margin of Safety in dollars =$960,000
Therefore, the expected margin of safety in dollars is $960,000 and as a percentage of sales is 33.3%.
6.
Calculate the operating leverage.
Explanation of Solution
Determine the operating leverage.
Contribution margin =$1,728,000 (11)
Income from operations =$576,000 (refer Table 1)
Working note (11):
Determine the contribution margin
Sales =$2,880,000 (1)
Variable cost =$1,152,000 (9)
Therefore, the operating leverage is 3.
Want to see more full solutions like this?
Chapter 6 Solutions
Managerial Accounting


- Cost-Volume-Profit, Margin of Safety Victoria Company produces a single product. Last years income statement is as follows: Required: 1. Compute the break-even point in units and sales dollars calculated using the break-even units. 2. What was the margin of safety for Victoria last year in sales dollars? 3. Suppose that Victoria is considering an investment in new technology that will increase fixed cost by 250,000 per year but will lower variable costs to 45% of sales. Units sold will remain unchanged. Prepare a budgeted income statement assuming that Victoria makes this investment. What is the new break-even point in sales dollars, assuming that the investment is made?arrow_forwardSales Revenue Approach, Variable Cost Ratio, Contribution Margin Ratio Arberg Companys controller prepared the following budgeted income statement for the coming year: Required: 1. What is Arbergs variable cost ratio? What is its contribution margin ratio? 2. Suppose Arbergs actual revenues are 30,000 more than budgeted. By how much will operating income increase? Give the answer without preparing a new income statement 3. How much sales revenue must Arberg earn to break even? Prepare a contribution margin income statement to verify the accuracy of your answer. 4. What is Arbergs expected margin of safety? 5. What is Arbergs margin of safety if sales revenue is 380,000?arrow_forwardIncome Statements under Absorption and Variable Costing In the coming year, Kalling Company expects to sell 28,700 units at 32 each. Kallings controller provided the following information for the coming year: Required: 1. Calculate the cost of one unit of product under absorption costing. 2. Calculate the cost of one unit of product under variable costing. 3. Calculate operating income under absorption costing for next year. 4. Calculate operating income under variable costing for next year.arrow_forward
- Quality Cost Report Loring Company had total sales of 2,400,000 for fiscal 20X1. The costs of quality-related activities are given below. Required: 1. Prepare a quality cost report, classifying costs by category and expressing each category as a percentage of sales. What message does the cost report provide? 2. Prepare a bar graph and pie chart that illustrate each categorys contribution to total quality costs. Comment on the significance of the distribution.arrow_forwardKatayama Company produces a variety of products. One division makes neoprene wetsuits. The divisions projected income statement for the coming year is as follows: Required: 1. Compute the contribution margin per unit, and calculate the break-even point in units. Repeat, using the contribution margin ratio. 2. The divisional manager has decided to increase the advertising budget by 140,000 and cut the average selling price to 200. These actions will increase sales revenues by 1 million. Will this improve the divisions financial situation? Prepare a new income statement to support your answer. 3. Suppose sales revenues exceed the estimated amount on the income statement by 612,000. Without preparing a new income statement, determine by how much profits are underestimated. 4. How many units must be sold to earn an after-tax profit of 1.254 million? Assume a tax rate of 34 percent. (Round your answer up to the next whole unit.) 5. Compute the margin of safety in dollars based on the given income statement. 6. Compute the operating leverage based on the given income statement. (Round to three significant digits.) If sales revenues are 20 percent greater than expected, what is the percentage increase in profits?arrow_forwardVariable Cost Ratio, Contribution Margin Ratio Chillmax Company plans to sell 3,500 pairs of shoes at 60 each in the coming year. Unit variable cost is 21 (includes direct materials, direct labor, variable factory overhead, and variable selling expense). Fixed factory overhead is 30,000 and fixed selling and administrative expense is 48,000. Required: 1. Calculate the variable cost ratio. 2. Calculate the contribution margin ratio. 3. Prepare a contribution margin income statement based on the budgeted figures for next year. In a column next to the income statement, show the percentages based on sales for sales, total variable cost, and total contribution margin.arrow_forward
- Cost Classification Loring Company incurred the following costs last year: Required: 1. Classify each of the costs using the following table format. Be sure to total the amounts in each column. Example: Direct materials, 216,000. 2. What was the total product cost for last year? 3. What was the total period cost for last year? 4. If 30,000 units were produced last year, what was the unit product cost?arrow_forwardBradshaw Company reported sales of 5,000,000 in 20X1. At the end of the fiscal year (June 30, 20X1), the following quality costs were reported: Required: 1. Prepare a quality cost report. 2. Prepare a graph (pie chart or bar graph) that shows the relative distribution of quality costs, and comment on the distribution. 3. Assuming sales of 5,000,000, by how much would profits increase if quality improves so that quality costs are only 3% of sales?arrow_forwardVariable-Costing and Absorption-Costing Income Borques Company produces and sells wooden pallets that are used for moving and stacking materials. The operating costs for the past year were as follows: During the year, Borques produced 200,000 wooden pallets and sold 204,300 at 9 each. Borques had 8,200 pallets in beginning finished goods inventory; costs have not changed from last year to this year. An actual costing system is used for product costing. Required: 1. What is the per-unit inventory cost that is acceptable for reporting on Borquess balance sheet at the end of the year ? How many units are in ending inventory? What is the total cost of ending inventory? 2. Calculate absorption-costing operating income. 3. CONCEPTUAL CONNECTION What would the per-unit inventory cost be under variable costing? Does this differ from the unit cost computed in Requirement 1? Why? 4. Calculate variable-costing operating income. 5. Suppose that Borques Company had sold 196,700 pallets during the year. What would absorption-costing operating income have been? Variable-costing operating income?arrow_forward
 Managerial AccountingAccountingISBN:9781337912020Author:Carl Warren, Ph.d. Cma William B. TaylerPublisher:South-Western College Pub
 Managerial Accounting: The Cornerstone of Busines...AccountingISBN:9781337115773Author:Maryanne M. Mowen, Don R. Hansen, Dan L. HeitgerPublisher:Cengage Learning
 Survey of Accounting (Accounting I)AccountingISBN:9781305961883Author:Carl WarrenPublisher:Cengage Learning
 Cornerstones of Cost Management (Cornerstones Ser...AccountingISBN:9781305970663Author:Don R. Hansen, Maryanne M. MowenPublisher:Cengage Learning
 Financial And Managerial AccountingAccountingISBN:9781337902663Author:WARREN, Carl S.Publisher:Cengage Learning,