Videos
Sketch a graph to check the variation of population and no. of bacteria are exponentially decrease and increase or not.
Answer to Problem 2CE
The solution is
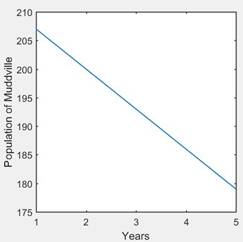
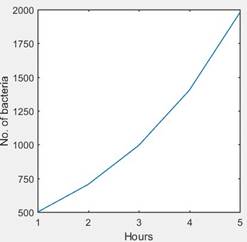
As we can see in the figure the population isn’t decrease exponentially, its decrease linearly. In the second figure the bacteria are exponentially increases.
Explanation of Solution
Given: The data is given
Calculation:
Using MATLAB just plot the data and check the variation of population and number of bacteria.
program:
clc
clear
close all
years=[1 2 3 4 5];
hours=[1 2 3 4 5];
population=[207 200 193 186 179];
Nbact=[500 705 994 1402 1977];
figure(1)
plot(years,population,'linewidth',1.2)
set(gca,'linewidth',1.2,'fontsize',12);
xlabel('Years')
ylabel('Population of Muddville')
axis square
figure(2)
plot(hours,Nbact,'linewidth',1.2)
set(gca,'linewidth',1.2,'fontsize',12,'YTick',(500:250:2000));
xlabel('Hours')
ylabel('No. of bacteria')
axis square
Query:
- First, we have defined the data value in the separate matrix.
- Then plot the graph.
- Check the variation of population and number of bacteria.
Chapter 7 Solutions
Algebra: Structure And Method, Book 1
Additional Math Textbook Solutions
Elementary and Intermediate Algebra
Algebra and Trigonometry
Algebra and Trigonometry (6th Edition)
Differential Equations and Linear Algebra (4th Edition)
College Algebra
Graphical Approach To College Algebra


 Algebra and Trigonometry (6th Edition)AlgebraISBN:9780134463216Author:Robert F. BlitzerPublisher:PEARSON
 Contemporary Abstract AlgebraAlgebraISBN:9781305657960Author:Joseph GallianPublisher:Cengage Learning
 Linear Algebra: A Modern IntroductionAlgebraISBN:9781285463247Author:David PoolePublisher:Cengage Learning
 Algebra And Trigonometry (11th Edition)AlgebraISBN:9780135163078Author:Michael SullivanPublisher:PEARSON
 Introduction to Linear Algebra, Fifth EditionAlgebraISBN:9780980232776Author:Gilbert StrangPublisher:Wellesley-Cambridge Press
 College Algebra (Collegiate Math)AlgebraISBN:9780077836344Author:Julie Miller, Donna GerkenPublisher:McGraw-Hill Education