
Concept explainers
Videos
a.
To make:
A
a.
Answer to Problem 33E
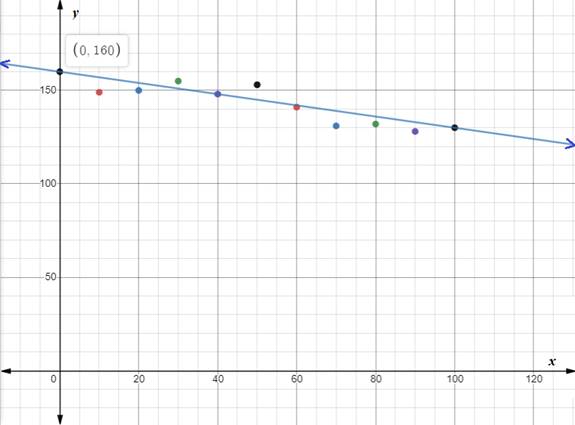
The line of best fit would look like:
Explanation of Solution
Given:
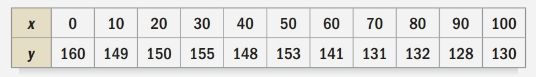
The table below shows the men’s winning timesin the Boston Marathon for every tenth year from 1900 to 2000. In the table, x represents the number of years since 1900, and y represents the corresponding winning time (to the nearest minute).

Calculation:
First of all, we will write our given data as ordered pairs
Now we will plotour given values on coordinate plane and draw a line of best fit as shown below:
b.
To write:
An equation for the line of best fit.
b.
Answer to Problem 33E
The equation for the line of the best fit would be
Explanation of Solution
Given:
The table below shows the men’s winning times in the Boston Marathon for every tenth year from 1900 to 2000. In the table, x represents the number of years since 1900, and y represents the corresponding winning time (to the nearest minute).

Calculation:
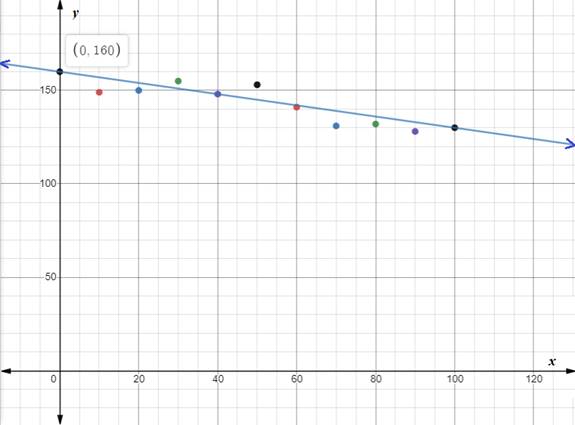
First of all, we will find slope of line passing through point (0,160) and (100,130) as:
Now we will use slope-intercept form to write our equation as:
Therefore, the equation for the line of the best fit would be
c.
To predict:
The men’s winning time in the Boston Marathon for the year 2010.
c.
Answer to Problem 33E
Men’s winning time in the Boston Marathon for the year 2010would be 127 minutes.
Explanation of Solution
Given:
The table below shows the men’s winning times in the Boston Marathon for every tenth year from 1900 to 2000. In the table, x represents the number of years since 1900, and y represents the corresponding winning time (to the nearest minute).

Calculation:
To predict men’s winning time in the Boston Marathon for the year 2010, we will substitute
Therefore, men’s winning time in the Boston Marathon for the year 2010 would be 127 minutes.
d.
Do you think your equation will accurately predict winning times far into the future? Explain your reasoning.
d.
Answer to Problem 33E
The equation will not accurately predict winning times far into the future.
Explanation of Solution
Given:
The table below shows the men’s winning times in the Boston Marathon for every tenth year from 1900 to 2000. In the table, x represents the number of years since 1900, and y represents the corresponding winning time (to the nearest minute).
Calculation:
The line of best fit is for our given data. The slope of the line is negative, so as the x values will increase the value of y will approach zero. Our equation for the line of best fit can predict winning times close to year 2000.
Since we cannot expect all data points to fall on the line of best fit, therefore, the equation will not accurately predict winning times far into the future.
Chapter 8 Solutions
Holt Mcdougal Larson Pre-algebra: Student Edition 2012
Additional Math Textbook Solutions
Intermediate Algebra for College Students (7th Edition)
College Algebra
College Algebra
Intermediate Algebra (7th Edition)
Graphical Approach To College Algebra
College Algebra (7th Edition)


 Algebra and Trigonometry (6th Edition)AlgebraISBN:9780134463216Author:Robert F. BlitzerPublisher:PEARSON
 Contemporary Abstract AlgebraAlgebraISBN:9781305657960Author:Joseph GallianPublisher:Cengage Learning
 Linear Algebra: A Modern IntroductionAlgebraISBN:9781285463247Author:David PoolePublisher:Cengage Learning
 Algebra And Trigonometry (11th Edition)AlgebraISBN:9780135163078Author:Michael SullivanPublisher:PEARSON
 Introduction to Linear Algebra, Fifth EditionAlgebraISBN:9780980232776Author:Gilbert StrangPublisher:Wellesley-Cambridge Press
 College Algebra (Collegiate Math)AlgebraISBN:9780077836344Author:Julie Miller, Donna GerkenPublisher:McGraw-Hill Education