
Videos
Develop a spreadsheet for computing the demand for any values of the input variables in the linear demand and nonlinear demand prediction models in Examples
To develop a spreadsheet for computing the demand for any values if the input variables in the linear demand and nonlinear demand prediction models.
Explanation of Solution
Given:
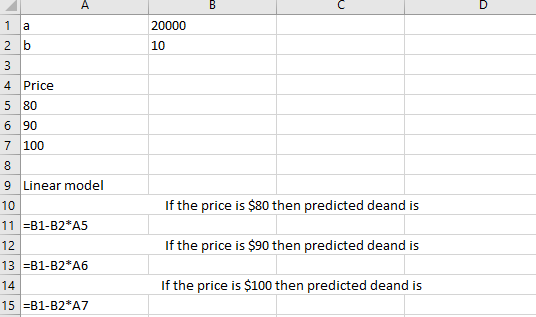
Linear model is,
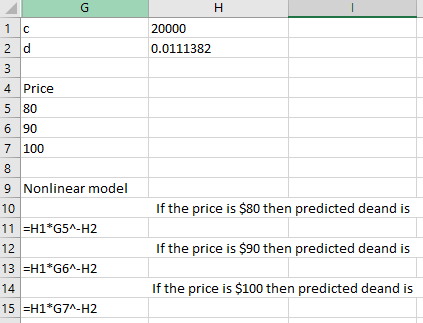
And Nonlinear model,
Following is the formulae used in spreadsheet for linear model:
Following is the formulae used in spreadsheet for Nonlinear model:
Following is the output for linear model:
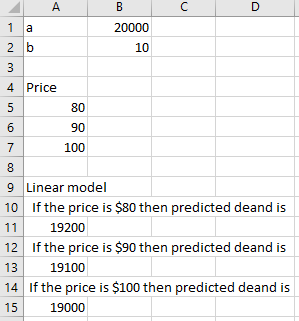
As per calculation, if the price increases then demand decreases.
Following is the output for Nonlinear model:
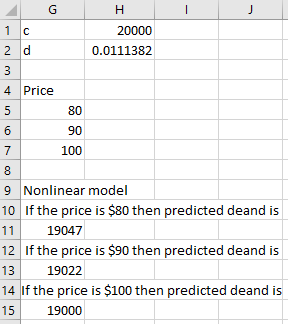
As per calculation, if the price increases then demand decreases.
Want to see more full solutions like this?
Chapter A1 Solutions
Business Analytics
Additional Math Textbook Solutions
APPLIED STAT.IN BUS.+ECONOMICS
Statistical Reasoning for Everyday Life (5th Edition)
Statistics: Informed Decisions Using Data (5th Edition)
Statistics Through Applications
Elementary Statistics (Text Only)
Elementary Statistics: A Step By Step Approach


- 23. Consider a simple economy with just two industries: farming and manufacturing. Farming consumes 1/2 of the food and 1/3 of the manufactured goods. Manufacturing consumes 1/2 of the food and 2/3 of the manufactured goods. Assuming the economy is closed and in equilibrium, find the relative outputs of the farming and manufacturing industries.arrow_forwardexplain and discuss the significance of langrage multiplier.arrow_forwardA herbal tea producer company has 24 different products in the market, each are produced in one of the 3 factories owned by the company. The weights of the products in monthly sales may vary depending on time of the year (demands of certain products shift to others in each of the 4 seasons), age of the products and market conditions, but yearly aggregate demand has a very strong correlation with the price of the product (Here, we ignore any other factor and assume that the yearly aggregate demand is directly and linearly effected by the price). The company found out that when the price for a packet of 20 herbal tea bags is 10 TL, yearly demand is 337500 packets. When the price increases to 11 TL, demand decreases to 337125 packets. On the cost side, the company has 1200000 TL of yearly administrative costs regardless of the price or the number of units sold, including the rents, depreciation of the buildings and other related assets and salaries of 58 workers (average monthly salary…arrow_forward
- Demand for stereo headphones and MP3 players for joggers has caused Nina Industries to grow almost 50 percent over the past year. The number of joggers continues to expand, so Nina expects demand for headsets to also expand, because, as yet, no safety laws have been passed to prevent joggers from wearing them. Demand for the players for this year was as follows: MONTH DEMAND (UNITS) January 4,200 February 4,300 March 4,000 April 4,400 May 5,000 June 4,700 July 5,300 August 4,900 September 5,400 October 5,700 November 6,300 December 6,000 Using linear regression analysis, what would you estimate demand to be for each month next year? Using a spreadsheet, follow the general format in Exhibit 3.7. Note: Do not round intermediate calculations. Round your answers to 2 decimal places. To be reasonably confident of meeting demand, Nina decides to use three standard errors of estimate for safety. How many additional units should be held to meet this level…arrow_forwardUsing customer demand data, a company estimates it needs to produce items at a takt time of 38 seconds per item. Based on the operator loading chart shown (as is, without balancing), this process can meet takt time. True or Falsearrow_forwardUse this data and and generate a model of the annual maintenance expenses based on the age of the bug. If my bus is 4.1 years old, what are the projected annual maintenance costs? (Enter a whole number) Age of Bus (years) Annual Maintenance Cost ($) 2.4 350 2.3 370 2.4 480 3.1 520 3 590 5.8 550 4.8 750 3.8 800 3.6 790 4.9 950 5.5 915arrow_forward
- estimate the equilibrium and quantity of the market whose demand and supply functions are Pd=-(q+4)2+100 and Ps=(q+2)2 respectivelyarrow_forwardWhat is a carrying capacity? Mathematically, how does it appearon the graph of a population function?arrow_forwardEstimate the equilibrium price and quantity of the market whose demand and supply functions are pd = −(q + 4)^2 + 100 and ps = (q + 2)^2 respectively.arrow_forward
 Linear Algebra: A Modern IntroductionAlgebraISBN:9781285463247Author:David PoolePublisher:Cengage Learning