
Decode information from each of the following station models:
Sea-level pressure ___________
Temperature ___________
Dew-point temperature ___________
Sky coverage ___________
Current weather ___________
Sea-level pressure ___________
Temperature ___________
Dew-point temperature ___________
Sky coverage ___________
Wind speed ___________
Wind direction ___________
Pressure change during last three hours ___________
Pressure tendency ___________
Sea-level pressure ___________
Temperature ___________
Dew-point temperature ___________
Sky coverage ___________
(a)
Decode information from each of the following station models:
Answer to Problem 1E
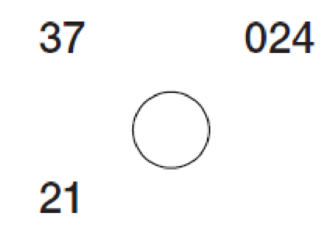
Sea-level pressure 1002.4 mb
Temperature 37⁰ F
Dew-point temperature 21⁰ F
Sky coverage CLEAR
Explanation of Solution
The given diagram represents an area with sea-level pressure 1002.4 mb. Temperature 37⁰ F, dew-point temperature with clear sky coverage. Values are identified using reference symbols given in the weather map lab analysis material.
(b)
Decode information from each of the following station models:
Answer to Problem 1E
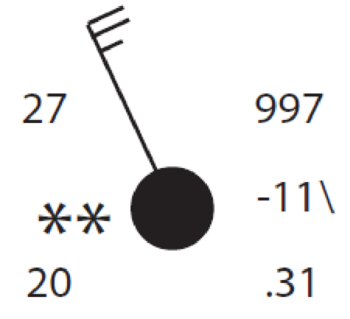
Current weather CONTINUOUS LIGHT SNOW
Sea-level pressure 999.7 mb
Temperature 27⁰ F
Dew-point temperature 20⁰ F
Sky coverage OVERCAST
Wind speed 23-27 KNOTS
Wind direction NORTH WEST
Pressure change
during last three hours 1.1 mb
Pressure tendency FALLING
Explanation of Solution
The given diagram represents an area with sea-level pressure 999.7 mb. Temperature 27⁰ F, dew-point temperature 20⁰ F with cloudy sky. The current weather of the area is continuous light snow. This weather represents a dry, windy conditions of the area because of high wind, low temperature and dew point temperature. Chances of rain are expected due to falling pressure. Values are identified using reference symbols given in the weather map lab analysis material.
(c)
Decode information from each of the following station models:
Answer to Problem 1E
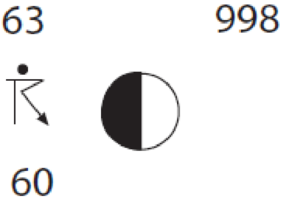
Sea-level pressure 999.8 mb
Temperature 63⁰ F
Dew-point temperature 60⁰ F
Sky coverage PARTLY CLOUDY
Current weather THUNDER WITH LIGHT RAIN
Explanation of Solution
The given diagram represents an area with sea-level pressure 999.8 mb. Temperature 63⁰ F, dew-point temperature 60⁰ F with partly cloudy sky. The current weather of the area is light rain with thunderstorms. Values are identified using reference symbols given in the weather map lab analysis material.
Want to see more full solutions like this?
Chapter 9 Solutions
Exercises for Weather & Climate (9th Edition)
Additional Science Textbook Solutions
Biology: Life on Earth with Physiology (11th Edition)
Microbiology: An Introduction
Human Physiology: An Integrated Approach (8th Edition)
Introductory Chemistry (6th Edition)
The Cosmic Perspective (8th Edition)
Physics for Scientists and Engineers: A Strategic Approach, Vol. 1 (Chs 1-21) (4th Edition)

- I need help with part b and c. I don't want an explanation I need the actual graph, because it's hard to understand an explanation without showing what they mean.arrow_forwardI need help with part b and c. I don't want an explanation I need the actual graph preferably broken down, because it's hard to understand an explanation without showing what they mean.arrow_forwardI need help with part b and c I don't know how to draw it.arrow_forward
- 4. What is the geologic range of the fossil shown in Figure 10.15? From the Ordovician period through the Permian period. 5. What is the geologic range of the fossil shown in Figure 10.16? From the Cambrian period through the Permian period. 6. Imagine that you have discovered a rock outcrop that contains the fossils identified in Questions 4 and 5. What is the geologic range of this rock?From theperiod through the period.arrow_forward4. What is the geologic range of the fossil shown in Figure 10.15? From the period through the period5. What is the geologic range of the fossil shown in Figure 10.16? From the period through the period.arrow_forwardACTIVITY 10.6 Types of Fossils Pg 174 1. Refer to Figure 10.13. Which photo(s) (A-1) best illustrate(s) the methods of fossilization or fossil evidence listed below? (Photos/letters may be used more than once.)Permineralization: The small internal cavities and pores of an original organism that are filled with precipitated mineral matter. Photo(s):Cast: The space once occupied by a dissolved shell or other structure that is subsequently filled with mineral matter. Photo(s):Carbonization: Preservation that occurs when fine sediment encases delicate plant or animal forms and leaves a residue of carbon, Photo(s):Impression: A replica of an organism, such as a leaf, left in fine-grained sedimentary rock. Photo(s):Amber: Hardened resin of ancient trees that preserved delicate organisms such as insects. Photo(s):Indirect evidence: Traces of prehistoric life but not the organism itself. Photo(s):arrow_forward
- ACTIVITY 10.7 Fossils as Time Indicators Pgs 175-176Use Figure 10.14, page 175, to complete the following. 1. What is the geologic range of plants that belong to the group Ginkgo?From theperiod through theperiod. 2. What is the geologic range of Lepidodendron, an extinct coal-producing plant?From theperiod through theperiod. 3. Imagine that you have discovered an outcrop of sedimentary rock that contains fossil shark teeth and fossils of Archimedes. In which time periods might this rock have formed?From theperiod through theperiod.arrow_forwardACTIVITY 10.4 Unconformities Pg 1721. Label the angular unconformity and disconformity on Figure 10.10. 2. Identify the types of unconformities in Figure 10.11A and Figure 10.11Barrow_forwardACTIVITY 10.3 Principles of Cross-Cutting and Inclusions Pg 171Figure 10.8 is a geologic cross-section of a hypothetical area. Use it to answer the following questions. 1. Is the igneous intrusion, dike E, older or younger than rock layers A-D? 2. Is fault H older or younger than rock layers A-D? 3. Is fault H older or younger than sedimentary layers F and G? 4. Did fault H occur before or after dike E? Explain how you arrived at your answer. 5. What evidence supports the conclusion that the igneous intrusion labeled sili B is more recent than the rock layers on either side (A and C)? ACTIVITY 10.5 Applying Relative Dating Principles Pg 173Use Figure 10.12 to complete the following. 1. Identify and label the unconformities in Figure 10.12. 2. Is rock layer I older or younger than layer H? What relative dating principle did you apply to determine your answer?Rock layer I isthan layer H.Relative dating principle: 3. Is fault L older or younger than rock layer D? What principle did you…arrow_forward
 Applications and Investigations in Earth Science ...Earth ScienceISBN:9780134746241Author:Edward J. Tarbuck, Frederick K. Lutgens, Dennis G. TasaPublisher:PEARSON
 Exercises for Weather & Climate (9th Edition)Earth ScienceISBN:9780134041360Author:Greg CarbonePublisher:PEARSON
 Environmental ScienceEarth ScienceISBN:9781260153125Author:William P Cunningham Prof., Mary Ann Cunningham ProfessorPublisher:McGraw-Hill Education
 Earth Science (15th Edition)Earth ScienceISBN:9780134543536Author:Edward J. Tarbuck, Frederick K. Lutgens, Dennis G. TasaPublisher:PEARSON
 Environmental Science (MindTap Course List)Earth ScienceISBN:9781337569613Author:G. Tyler Miller, Scott SpoolmanPublisher:Cengage Learning
 Physical GeologyEarth ScienceISBN:9781259916823Author:Plummer, Charles C., CARLSON, Diane H., Hammersley, LisaPublisher:Mcgraw-hill Education,