What is Decision Analysis?
Decision analysis is a quantitative, systematic, and visual approach to address significant choices that a business might face. The term decision analysis was coined in 1964 by Management Science Professor Ronal A. Howard from the Stanford University. This approach is used by organizations to make important decisions related to management, marketing, operations, strategic choices, and capital investments.
Understanding Decision Analysis
Decision analysis identifies and assesses all aspects of a probable decision and helps the organization take actions depending on which decision generates the most desired outcome. Decision analysis helps the decision-making process by analyzing relevant information and available options. It can be a personal life decision like investment options for retirement or an organizational decision regarding foreign investments.
Decision analysis helps organizations evaluate and model the probable outcomes of the decisions that can be taken to achieve the most favorable outcome. Such analysis involves understanding goals & results and the uncertainties that come along in the process. It also involves measuring the expected outcomes of the many decisions with the use of probabilities.
One of the most significant aspects that allow for further analysis is framing the problem. This is the first step to decision analysis and involves crafting a framework to analyze the problem from various perspectives. This can include action items, opportunity statements, and measures of success.
Once the framework is created, a model is developed to analyze the favorability of a range of outcomes.
Decision Trees
Models visually represent the expected outcomes of the multiple decisions and help evaluate the outcomes. Businesses model the many expected outcomes and measure the probability to then choose the decision that yields the most favorable outcome. Decision trees are one of the common models used in decision analysis. These models are tree-shaped, with the branches representing potential outcomes. Decision trees are simple to understand and generate valuable insights into a problem by creating outcomes, alternative courses of action, and probabilities of the multiple decisions. A decision tree makes it easy to assess which decision leads to the most favorable outcome.
Expected Value (EV)
After a model is created, the Expected Value (EV) is found out to assess which decision will lead to the most favorable outcome. Decision trees provide all the probable outcomes in contrast to the alternatives. Calculating expected Value helps find out the average outcomes of the decisions and make informed decisions. To calculate the expected Value, outcome probabilities and the resulting values are required.
Expected Value = (Probability A x Expected Payoff A) + (Probability B x Expected Payoff A)
It is assumed that there are two outcomes to a business decision – success or failure. The expected payoff stands for the expected gain or loss that comes with each outcome. When multiple decisions are involved, the business will determine the most favorable outcome after calculating an expected value for each decision.
Decision Tree Analysis
A decision tree maps the probable outcomes of multiple decisions and helps weigh the course of action based on the costs involved, probabilities, and achieved benefits. A decision tree helps map out an algorithm and helps mathematically predict the best option. A decision tree starts with a single node, which then branches off into other possibilities and possible outcomes. The different components of the decision tree are the chance node, represented by a circle that illustrates the probability of some results. A decision node, represented by a square, illustrates the decisions to be taken, and the end not, represented by a triangle, illustrates the end outcome of the final deliverable of a decision path.
Example
- To draw a decision tree, start with the main decision represented by a small box. The lines to the right of the box denote course of action or a possible solution

2.The chance and decision nodes are added to expand the tree. If another decision is required, another box is added. Circle or the chance node denotes an uncertain outcome

3. The tree is expanded till all the lines reach the triangle endpoints. This states that there are no more choices and outcomes to consider. Values are assigned to each probable outcome.
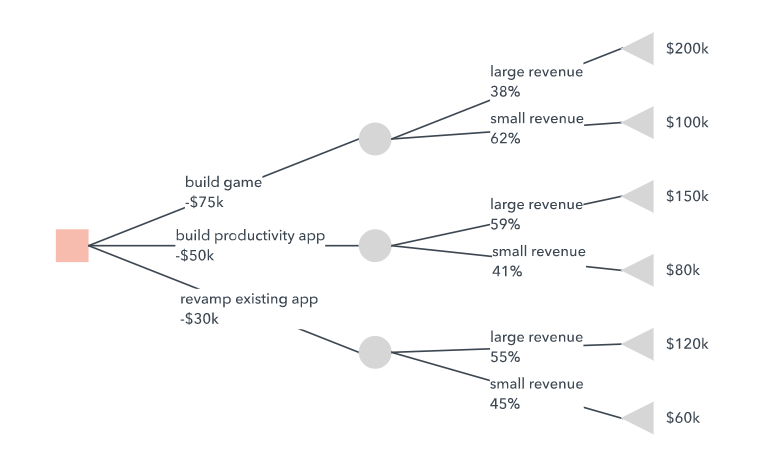
Once the decision tree is complete, decision analysis can begin. The expected value is calculated for each decision or choice mapped on the tree to minimize risk and maximize the chance of achieving the most favorable outcome. The following diagram illustrates how to calculate the expected value for the above decision tree example.

The decision maker’s preference has to be accounted for while choosing desirable outcomes. Some businesses might prefer to go with a low-risk option, while some might choose a high-risk option to earn a bigger benefit.
Influence Diagram
Influence diagrams are related and often used in conjunction with decision trees. Much like a flow chart, an influence diagram comprises four variable types for notation. A rectangle represents a decision, an oval represents a chance, a hexagon shows an objective, and a rounded rectangle represents a function. Where decision trees illustrate much more details regarding possible decisions, influence diagrams illustrate the dependencies among variables. Influence Diagram helps by offering a higher level of understanding of the discoveries from the decision tree.

Bayesian Decision Making
Bayesian decision theory was pioneered by Robert Osher Schlaifer. In the process of Bayesian decision-making, the decision is made on the basis of the probability of a favorable outcome, where both prior information and new evidence form the basis for this probability. Bayesian statistics is a mathematical model where a probability is used to represent uncertainty regarding output and input within the model. Any statistical model can be modified into a Bayesian model by using a probability for everything. This also holds true for models based on maximum likelihood or probabilistic models.
What is a Probabilistic Model?
A probabilistic model or method is built around the theory of probability. It is based on the fact that randomness has a big hand in predicting events in the future. The opposite of probabilistic is deterministic, which cuts out the complication of randomness and believes in exact predictions. Probabilistic models incorporate probability distributions and random variables into an event model. While the probabilistic model is based on the fact that there is always an element of uncertainty or randomness to be considered and uses probability distribution, the deterministic model suggests one single outcome for an event.
What is a Multiple Criteria Decision Analysis (MCDA)?
A Multiple-Criteria Decision Analysis (MCDA) or Multi-Criteria Analysis evaluates multiple conflicting criteria in the process of decision analysis. MCDA is like a cost-benefit analysis but with the advantage of not being reduced to only monetary units for comparisons. Multiple criteria and levels of scale are accounted for when making significant decisions. Comparing conflicting criteria like costs and quality can be confusing. MCDA tool helps bring clarity with the decision-making process when multiple criteria are involved. Structuring complex issues and analyzing multiple criteria sets based on information can help make justifiable decisions.
Summarizing Decision Analysis
Sensitivity Analysis
The financial model Sensitivity analysis determines how changes in input variables can affect target variables. Sensitivity analysis is also known as simulation or what-if analysis. This model helps to predict the decision outcome based on a range of variables.
Risk Analysis
Risk analysis identifies and analyses potential threats and issues that can have a negative impact on business initiatives. It helps organizations mitigate risks. Risk analysis assesses uncertain adverse events that can occur within government, environmental, or corporate sectors, like variance in forecasted cash flow streams or the probable outcome of the projects in terms of success or failure.
Decision Maker
A decision-maker is an employee who makes challenging decisions as a leader that impacts the working of an organization. Decision-makers use critical thinking and problem-solving skills to figure out solutions for the arising problems and decide on the best outcome for the success of the company.
Utility Function
The utility function is an important concept in economics. It measures the consumers’ preference for certain services or products over others. It represents the satisfaction received by consumers for choosing a particular service or product. Economists ascertain the utility of one good over another good, and a numerical value is assigned to the utility.
Common Mistake
Decision-makers have to often cope with uncertainty, conflict, and ambiguity as far as tough decision scenarios and the encompassing behavioral factors are concerned. Students should differentiate the procedure into three types of varied situations –
- Single decision-maker or dominant stakeholder
- Known multiple stakeholders
- Multiple stakeholders with conflicting objectives and the likelihood of unknown interest segments
This aids the mixed-mode decision processes by formulating information as per the three different situations.
Context and Applications
This topic is significant in the professional exams for both undergraduate and graduate courses –
- Bachelor of Commerce
- Masters of Commerce
- BBA
- MBA
Related Courses
- Strategic Operations Management
- Advanced Operations Management
- Operations Research
- Advanced Economics
- Foreign Trade
References
- Lucid. (n.d.). What is a Decision Tree Diagram? Retrieved April 5, 2021, from https://www.lucidchart.com: https://www.lucidchart.com/pages/decision-tree
- Spicelogic. (2019, November 14). Getting started with Influence Diagram. Retrieved April 5, 2021, from https://www.spicelogic.com: https://www.spicelogic.com/docs/RationalWill/InfluenceDiagram/Influence-Diagram-287
Want more help with your operations management homework?
*Response times may vary by subject and question complexity. Median response time is 34 minutes for paid subscribers and may be longer for promotional offers.
Search. Solve. Succeed!
Study smarter access to millions of step-by step textbook solutions, our Q&A library, and AI powered Math Solver. Plus, you get 30 questions to ask an expert each month.
Decision Analysis Homework Questions from Fellow Students
Browse our recently answered Decision Analysis homework questions.
Search. Solve. Succeed!
Study smarter access to millions of step-by step textbook solutions, our Q&A library, and AI powered Math Solver. Plus, you get 30 questions to ask an expert each month.