What is Statistical Process Control?
The use of statistical methods to observe and manage a process to make sure that it operates at its full potential and thus produce a confirming product is called Statistical Process Control.
It is defined as the use of appropriate statistical techniques to understand processes & control a process or production method. This is an analytical decision-making tool that showswhen a process is working correctly and when it is not.
Traditional Method Vs. Statistical Process Control (SPC)
The quality of the finished product was traditionally achieved through inspection, accepting, or rejecting each product (or samples from a production lot) based on how well it met its design specifications.
To monitor the performance of the production process, SPC uses Statistical tools and predicts significant deviations that may later result in rejection.
Types of Variation
Two kinds of variation occur in the processes
- Natural or common cause variation consists of the inherently present factors that are available during the design stage. This comprises variations in temperature, properties of raw materials, the strength of an electrical current. If the common cause is the only type of variation that exists in the process, then the process is said to be 'In Control' and stable. It is also known as "Controlled Variation." The predictable outcome which is within the bounds of the control limits can be achieved provided the process operates within the control variation.

- Special Cause Variation or Assignable Cause Variation could be inferred with sufficient investigation. If special cause variation exists within the process, then the process is said to be 'out of control' and unstable. It is also known as "Uncontrolled Variation." The outcome of the process is unpredictable; a customer may be satisfied or unsatisfied given this unpredictability
SPC Activities
- Understanding the process: The process is usually mapped out and monitored using control charts.
- Understanding the cause of variation: Additional effort is exerted to determine causes of that variance in the following scenarios:
- When the control chart detection rules identify the excessive variation.
- The processing capability is found lacking.
3. Understanding the tools used which include –
- Ishikawa Diagram
- Pareto charts
Process underlying the above activities:
- Once the causes of variation have been quantified, the effort is spent in eliminating those causes that are both statistically and practically significant.
- As the causes of variation have been computed, exertion goes into eliminating those causes that are both statistically and practically significant.
- This involves the development of standard work, error-proofing, and training.
- More changes in the process may be required in order to reduce variation or align the process with the desired target, especially if there is a problem with process capability.
Benefits of SPC
- Reduces waste
- Maximize Productivity
- Improved Resource Utilization
- Increased Operational efficiency
- It reduces the cost
- Improved customer satisfaction & relationship
- Improved & consistent product quality
- Early detection and prevention of problems
- Decreased manual inspections
- Scope for a prolonged reduction in process variability
- Determines the capability of the process
SPC Charts
It is a type of method for identifying the type of variation present.
Statistical Process Control charts are essential because:
- Simple graphical tools that enable process performance monitoring.
- Designed to identify which type of variation exists within the process.
- Designed to highlight areas that may require further investigation.
- Easy to construct and interpret
Two most popular SPC tools:
- Run Chart
- Control Chart
Statistical Process Control (SPC) charts can be applied to both dynamic processes and static processes.
Dynamic Processes
- A process that is analyzed over a period of time is known as a dynamic process.
- An SPC chart for a dynamic process – 'time-series or a 'longitudinal' SPC chart.
Static Processes
- A process that is examined at a specific point in time is known as a static process.
- An SPC chart for a static process is often referred to as a 'cross sectional' SPC chart.
Control Chart
- Scrutinize processes to examine the performance and the effect of changes to the process and its capabilities. These observations are very useful in making improvements to the quality of the process.
- Used to determine the capability of the process.
- Help to identify special or assignable causes for factors that impede peak performance.
Key features of Control charts
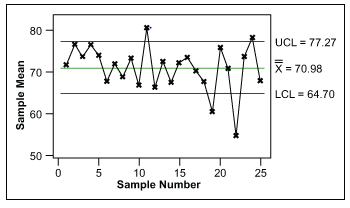
1) Data Points: Either averages of subgroup measurements or individual measurements plotted on the x/y axis and joined by a line. Time is always on the x-axis.
2) The Average or Center Line:The average or mean of the data points and is drawn acrossthe middle section of the graph, usually as a heavy or solid line.
3) The Upper Control Limit (UCL): Drawn above the centerline and annotated as "UCL." This is called the "+ 3 sigma" line.
4) The Lower Control Limit (LCL): Drawn below the centerline and annotated as "LCL." This is called the "- 3 sigma" line.

The area between each control limit and the centerline is divided into three zones.
1) Zone A – "1-sigma zone"
2) Zone B – "2-sigma zone"
3) Zone C – "3-sigma zone"

Types of Control Chart
There are two broad categories of control charts –
1) Control chart for Continuous data
2) Control chart for Discrete data
Control chart for Continuous Data:
Individuals and Moving Range (I-MR) Chart:
For continuous data, the most commonly used control chart is "Individuals and Moving Range" (I-MR). It is applicable when one data point is collected at each point in time. In fact, it is two different charts used in tandem. Together they monitor the process average as well as process variation...
Xbar-Range (Xbar-R) Chart:
This is also one of the most commonly used control charts for continuous data. Similar to the I-MR chart, it consists of two charts used in tandem. The Xbar-R chart is used when rationally collects measurements in subgroups of between 2 and 10 observations.
This chart is used to evaluate the stability of the process averages by plotting the average of each subgroup. This chart has the capability to detect relatively large shifts (typically ± 1.5 σ or larger) in the process average.
Control chart for Discrete Data:
c-Chart:
Used when identifying the total count of defects per unit (c) that occurred during the sampling period, the c-chart allows assigning each sample more than one defect. This chart is useful only when the number of samples of each sampling period is essentially the same.
u-Chart:
Like the c-chart, to track the total count of defects per unit (u) that occur during the sampling period, the u-chart is used. Furthermore, it can track a sample having more than one defect. However, the only difference with respect to the c-chart, u-chart is used when the number of samples of each sampling period may vary significantly.
np-Chart:
The np-chart is used to identify the total count of defective units with a constant sampling size. The unit may have one or more defects.
p-Chart:
The p-chart is used when each unit can be considered pass or fail irrespective of the number of defects. The p-chart explains the number of tracked failures (np) divided by the number of total units (n).
How to Select a Control Chart
Various factors need to be considered when identifying the type of control chart to be used, such as:
- The charts that measure variation on a continuous scale (Variables control charts) are more sensitive to change than those charts that measure variation on a discrete scale (Attribute control charts).
- Variables charts are useful for processes such as measuring tool wear.
- Use an individual chart (I-chart) when few measurements are available (e.g., when they are infrequent or are particularly costly). These charts become essential when the natural subgroup is unknown.
- A measure of defective units is found with u– and c-charts.
- The defects present within the unit must not be dependent on each other. Examples would be the component failures on a printed circuit board or the number of defects on a billing statement.
- Use a u-chart for continuous items, such as fabric (e.g., defects per square meter of cloth).
- A c-chart is a useful alternative to a u-chart when there are a lot of possible defects on a unit, but there is only a small chance of any single flaw occurring (e.g., flaws in a roll of material).
- When charting proportions, p– and np-charts are useful (e.g., compliance rates or process yields).
Common Mistakes:
Following are the five most prevalent and costly mistakes I witness in the application of SPC.
Capability before stability
Capability is a critical metric, and customers want assurance that processes are capable of meeting their requirements. These necessities corresponded as tolerances or specifications. However, the first issue to be addressed is getting to a stable, predictable process. Building control charts into the analytical process on the front end can prevent costly mistakes such as producing scrap, shipping unacceptable products, or even being forced to issue recalls.
Not assessing the measurement system
Measurement systems analysis (MSA) is a critical area that is easily overlooked when while focusing on SPC, but even the best application of SPC tools can be undermined when the ability to measure things is uncertain.
Failure to manage the measurement system
In addition to the MSA tools, need to properly manage measuring devices. How well is measurement equipment managed? What is the calibration interval? What steps are checked during a calibration? What is the calibration history for a specific device? Which master gauges have been used for the calibration, and are those devices calibrated?
Certain software applications such as PQ Systems' GAGEpack have been designed for this purpose and can help assess and manage measurement systems.
Creating and viewing too many charts for too few signals
The creation and arrangement of SPC charts have been made simpler with the help of technology. Although this can have many advantages, the amount of time spent by valuable workers doing repetitive, non-value-added, SPC-related work can be costly. To monitor dozens or even hundreds of SPC charts, but need to look for methods of scaling SPC application. The following steps might be time-consuming and need to be considered.
- Find the chart of interest
- Display the chart
- Analyze the chart
- Decide if action is needed or not
Misuse of control limits
The development of control charts does not assure accurate process feedback. There may be many intricacies with the application of control limits that can easily go wrong. Here are a few common errors:
- Computing wrong limit values with a home-grown tool
- Never computing static control limits
- Never re-computing control limits
- Waiting to have enough data to compute control limits
- Confusing specification limits with control limits
Context and Applications:
This topic is significant in graduate and postgraduate courses, especially for:
- Bachelor of Commerce
- Master of Commerce
- Master of Business Administration
Related Concepts
- Quality Controls
- 7 QC Tools
- Capability Analysis
Want more help with your operations management homework?
*Response times may vary by subject and question complexity. Median response time is 34 minutes for paid subscribers and may be longer for promotional offers.
Search. Solve. Succeed!
Study smarter access to millions of step-by step textbook solutions, our Q&A library, and AI powered Math Solver. Plus, you get 30 questions to ask an expert each month.
Statistical Process Control Homework Questions from Fellow Students
Browse our recently answered Statistical Process Control homework questions.
Search. Solve. Succeed!
Study smarter access to millions of step-by step textbook solutions, our Q&A library, and AI powered Math Solver. Plus, you get 30 questions to ask an expert each month.