3) (9.8) A random sample of n = 12 four-year-old red pine trees was selected, and the diameter (in inches) of each tree's main stem was measured. The resulting observations are given below. (don't forget units) 11.5 10.8 12.2 15.9 10.4 12.4 16.9 10.1 11.2 11.0 10.8 12.0 (data totals 145.2) a) (3) Compute a point estimate of σ, the population standard deviation of main stem diameters. (Round to 3 dec) Use your calculator, no work needs to be shown. Answer: b) (3) Suppose that the diameter distribution is normal. Then the 90th percentile of the diameter distribution is +1.28 σ (so 90% of all trees have diameters less than this value). Compute a point estimate for this percentile. (Hint: First compute an estimate of μ and then use it along with your estimate of σ from part (a). Round answer to three decimal places.) estimate of μ: Sketch and shade the 90th percentile labeling the mean & your answer below
3) (9.8) A random sample of n = 12 four-year-old red pine trees was selected, and the diameter (in inches) of each tree's main stem was measured. The resulting observations are given below. (don't forget units) 11.5 10.8 12.2 15.9 10.4 12.4 16.9 10.1 11.2 11.0 10.8 12.0 (data totals 145.2) a) (3) Compute a point estimate of σ, the population standard deviation of main stem diameters. (Round to 3 dec) Use your calculator, no work needs to be shown. Answer: b) (3) Suppose that the diameter distribution is normal. Then the 90th percentile of the diameter distribution is +1.28 σ (so 90% of all trees have diameters less than this value). Compute a point estimate for this percentile. (Hint: First compute an estimate of μ and then use it along with your estimate of σ from part (a). Round answer to three decimal places.) estimate of μ: Sketch and shade the 90th percentile labeling the mean & your answer below

Glencoe Algebra 1, Student Edition, 9780079039897, 0079039898, 2018
18th Edition
ISBN:9780079039897
Author:Carter
Publisher:Carter
Chapter10: Statistics
Section10.4: Distributions Of Data
Problem 19PFA

Related questions
Question
3.9.8
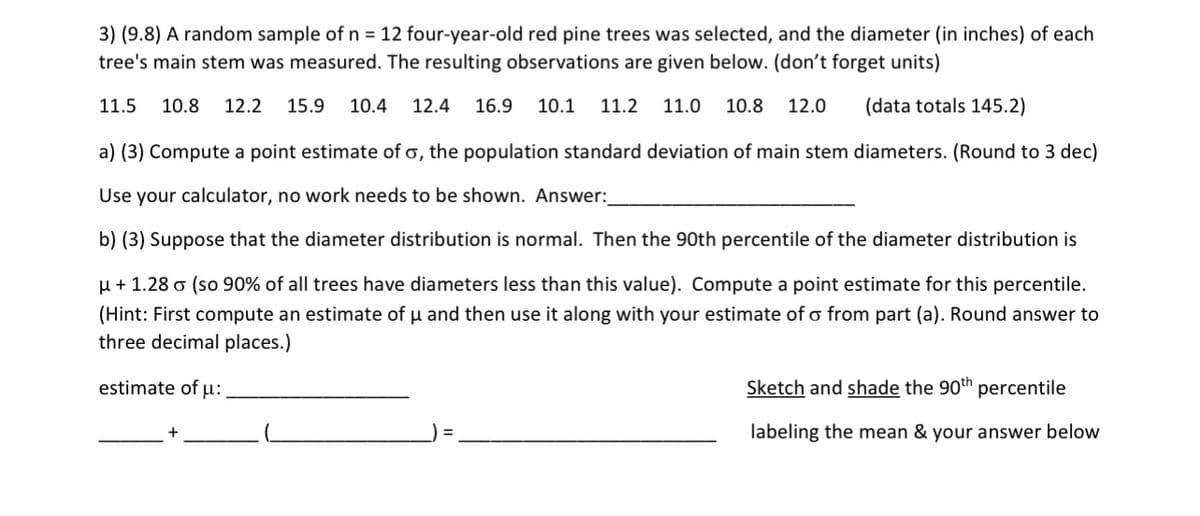
Transcribed Image Text:3) (9.8) A random sample of n = 12 four-year-old red pine trees was selected, and the diameter (in inches) of each
tree's main stem was measured. The resulting observations are given below. (don't forget units)
11.5 10.8 12.2 15.9 10.4 12.4 16.9 10.1 11.2 11.0 10.8 12.0 (data totals 145.2)
a) (3) Compute a point estimate of σ, the population standard deviation of main stem diameters. (Round to 3 dec)
Use your calculator, no work needs to be shown. Answer:
b) (3) Suppose that the diameter distribution is normal. Then the 90th percentile of the diameter distribution is
+1.28 σ (so 90% of all trees have diameters less than this value). Compute a point estimate for this percentile.
(Hint: First compute an estimate of μ and then use it along with your estimate of σ from part (a). Round answer to
three decimal places.)
estimate of μ:
Sketch and shade the 90th percentile
labeling the mean & your answer below
Expert Solution
This question has been solved!
Explore an expertly crafted, step-by-step solution for a thorough understanding of key concepts.

This is a popular solution!

Trending now
This is a popular solution!

Step by step
Solved in 1 steps with 2 images

Recommended textbooks for you
Glencoe Algebra 1, Student Edition, 9780079039897…
Algebra
ISBN:
9780079039897
Author:
Carter
Publisher:
McGraw Hill
Glencoe Algebra 1, Student Edition, 9780079039897…
Algebra
ISBN:
9780079039897
Author:
Carter
Publisher:
McGraw Hill