take recommendations. nfo al: Jane Doe Female Info: Demo 2023 Aug 7 (All) Level: Sedentary .0 Change: None components S s from Fat s from SatFat (g) (% Calories) drates (g) drates (% Calories) ugars (g) Sugar (g) Fiber (g) Fiber (g) le Fiber (g) Calories) ed Fat (g) at (g) at (g) (g) erol (mg) 6 A - RAE (mcg) B1- Thiamin (mg) B2 - Riboflavin B3 - Niacin B6 (mg) B12 (mcg) C (mg) D - mcg (mcg) E-a-Toco (mg) 25 yrs Marta 5 ft 5 in NUTR10 Value 2,405.00 1,094.00 442.00 84.70 14.10 244.00 40.60 155.00 A 43.00 6.65 0.79 3.59 122.00 45.50 49.20 2.24 35.40 26.90 576.00 1,455.00 792.00 0.68 1.39 31.90 1.54 1.59 59.10 1.06 5.87 150 lb (Strive for an Active activity level.) Normal is 18.5 to 25. Best not to exceed 2 lbs per week. DRI Goal Percen 0 2,017.0 565.0 182.0 54.4* 11.0* 277.0 55.0 25.2- 28.2 22.4 20.2 300.0~ 62.7 194% 28.0 162 % 20.2~ 244 % 2,700.0 119 % 194 % 244 % 156 % 128 % 88 % 74 % 700.0 1.1 1.1 14.0 1.3 2.4 75.0 15.0 15.0 171 % 24 % 158 % 133 % 192 % 54% 113 % 62 % 127 % 228 % 119 % 66 % 79 % 7% 39 % 50 100 150
take recommendations. nfo al: Jane Doe Female Info: Demo 2023 Aug 7 (All) Level: Sedentary .0 Change: None components S s from Fat s from SatFat (g) (% Calories) drates (g) drates (% Calories) ugars (g) Sugar (g) Fiber (g) Fiber (g) le Fiber (g) Calories) ed Fat (g) at (g) at (g) (g) erol (mg) 6 A - RAE (mcg) B1- Thiamin (mg) B2 - Riboflavin B3 - Niacin B6 (mg) B12 (mcg) C (mg) D - mcg (mcg) E-a-Toco (mg) 25 yrs Marta 5 ft 5 in NUTR10 Value 2,405.00 1,094.00 442.00 84.70 14.10 244.00 40.60 155.00 A 43.00 6.65 0.79 3.59 122.00 45.50 49.20 2.24 35.40 26.90 576.00 1,455.00 792.00 0.68 1.39 31.90 1.54 1.59 59.10 1.06 5.87 150 lb (Strive for an Active activity level.) Normal is 18.5 to 25. Best not to exceed 2 lbs per week. DRI Goal Percen 0 2,017.0 565.0 182.0 54.4* 11.0* 277.0 55.0 25.2- 28.2 22.4 20.2 300.0~ 62.7 194% 28.0 162 % 20.2~ 244 % 2,700.0 119 % 194 % 244 % 156 % 128 % 88 % 74 % 700.0 1.1 1.1 14.0 1.3 2.4 75.0 15.0 15.0 171 % 24 % 158 % 133 % 192 % 54% 113 % 62 % 127 % 228 % 119 % 66 % 79 % 7% 39 % 50 100 150

Related questions
Question
1. How many grams of fat did Jane consume?
2. How many kcal from fat?
3. What percentage of total kcal were provided ?
Saturated Fat:
1.How many grams of saturated fat did Jane eat?
2.How many kcals of saturated fat did Jane eat?
3. What percentage of total kcal does this represent?
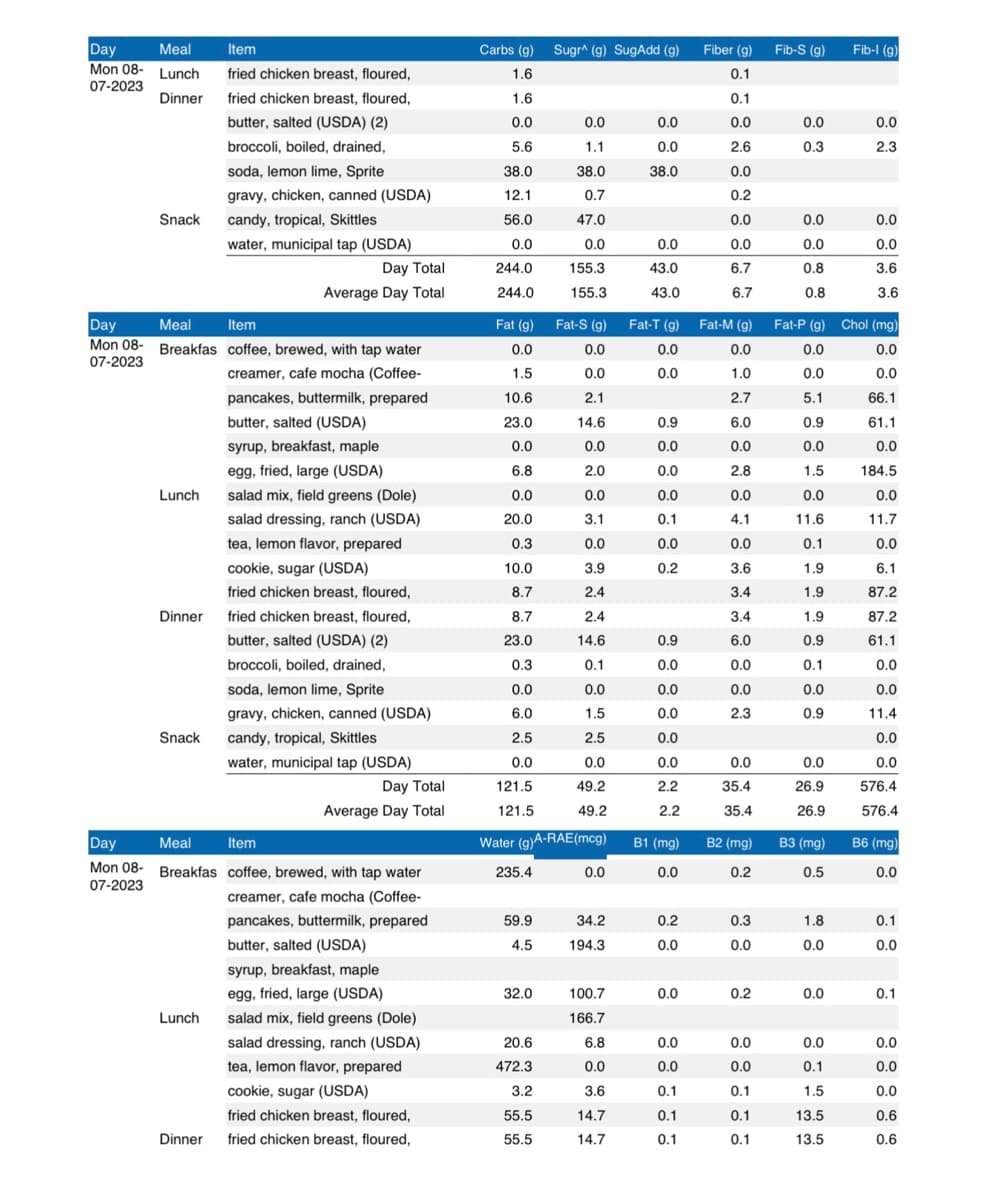
Transcribed Image Text:Day
Mon 08-
07-2023
Meal
Lunch
Dinner
Snack
Lunch
Day
Meal
Item
Mon 08- Breakfas coffee, brewed, with tap water
07-2023
creamer, cafe mocha (Coffee-
pancakes, buttermilk, prepared
butter, salted (USDA)
syrup, breakfast, maple
egg, fried, large (USDA)
salad mix, field greens (Dole)
salad dressing, ranch (USDA)
tea, lemon flavor, prepared
cookie, sugar (USDA)
fried chicken breast, floured,
fried chicken breast, floured,
butter, salted (USDA) (2)
broccoli, boiled, drained,
soda, lemon lime, Sprite
gravy, chicken, canned (USDA)
candy, tropical, Skittles
water, municipal tap (USDA)
Dinner
Snack
Item
fried chicken breast, floured,
fried chicken breast, floured,
butter, salted (USDA) (2)
broccoli, boiled, drained,
soda, lemon lime, Sprite
gravy, chicken, canned (USDA)
candy, tropical, Skittles
water, municipal tap (USDA)
Lunch
Day Total
Average Day Total
Dinner
Day
Meal
Item
Mon 08- Breakfas coffee, brewed, with tap water
07-2023
creamer, cafe mocha (Coffee-
pancakes, buttermilk, prepared
Day Total
Average Day Total
butter, salted (USDA)
syrup, breakfast, maple
egg, fried, large (USDA)
salad mix, field greens (Dole)
salad dressing, ranch (USDA)
tea, lemon flavor, prepared
cookie, sugar (USDA)
fried chicken breast, floured,
fried chicken breast, floured,
Carbs (g) Sugr^ (g) SugAdd (g) Fiber (g) Fib-S (g)
1.6
0.1
1.6
0.0
5.6
38.0
12.1
56.0
0.0
244.0
244.0
Fat (g)
0.0
1.5
10.6
23.0
0.0
6.8
0.0
20.0
0.3
10.0
8.7
8.7
23.0
0.3
0.0
6.0
2.5
0.0
121.5
121.5
235.4
Water (g)A-RAE(mcg)
59.9
4.5
32.0
0.0
1.1
38.0
0.7
47.0
0.0
155.3
155.3
20.6
472.3
3.2
55.5
55.5
Fat-S (g)
0.0
0.0
2.1
14.6
0.0
2.0
0.0
3.1
0.0
3.9
2.4
2.4
14.6
0.1
0.0
1.5
2.5
0.0
49.2
49.2
0.0
34.2
194.3
100.7
166.7
6.8
0.0
3.6
14.7
14.7
0.0
0.0
38.0
0.0
43.0
43.0
Fat-T (g)
0.0
0.0
0.9
0.0
0.0
0.0
0.1
0.0
0.2
0.9
0.0
0.0
0.0
0.0
0.0
2.2
2.2
B1 (mg)
0.0
0.2
0.0
0.0
0.0
0.0
0.1
0.1
0.1
0.1
0.0
2.6
0.0
0.2
0.0
0.0
6.7
6.7
Fat-M (g)
0.0
1.0
2.7
6.0
0.0
2.8
0.0
4.1
0.0
3.6
3.4
3.4
6.0
0.0
0.0
2.3
0.0
35.4
35.4
B2 (mg)
0.2
0.3
0.0
0.2
0.0
0.0
0.1
0.1
0.1
0.0
0.3
0.0
0.0
0.8
0.8
0.0
26.9
26.9
B3 (mg)
0.5
Fat-P (g) Chol (mg)
0.0
0.0
0.0
0.0
5.1
66.1
0.9
61.1
0.0
0.0
1.5
184.5
0.0
0.0
11.6
11.7
0.1
0.0
1.9
6.1
1.9
87.2
1.9
87.2
0.9
61.1
0.1
0.0
0.0
0.0
0.9
11.4
0.0
0.0
576.4
576.4
1.8
0.0
0.0
Fib-1 (g)
0.0
0.1
1.5
13.5
13.5
0.0
2.3
0.0
0.0
3.6
3.6
B6 (mg)
0.0
0.1
0.0
0.1
0.0
0.0
0.0
0.6
0.6
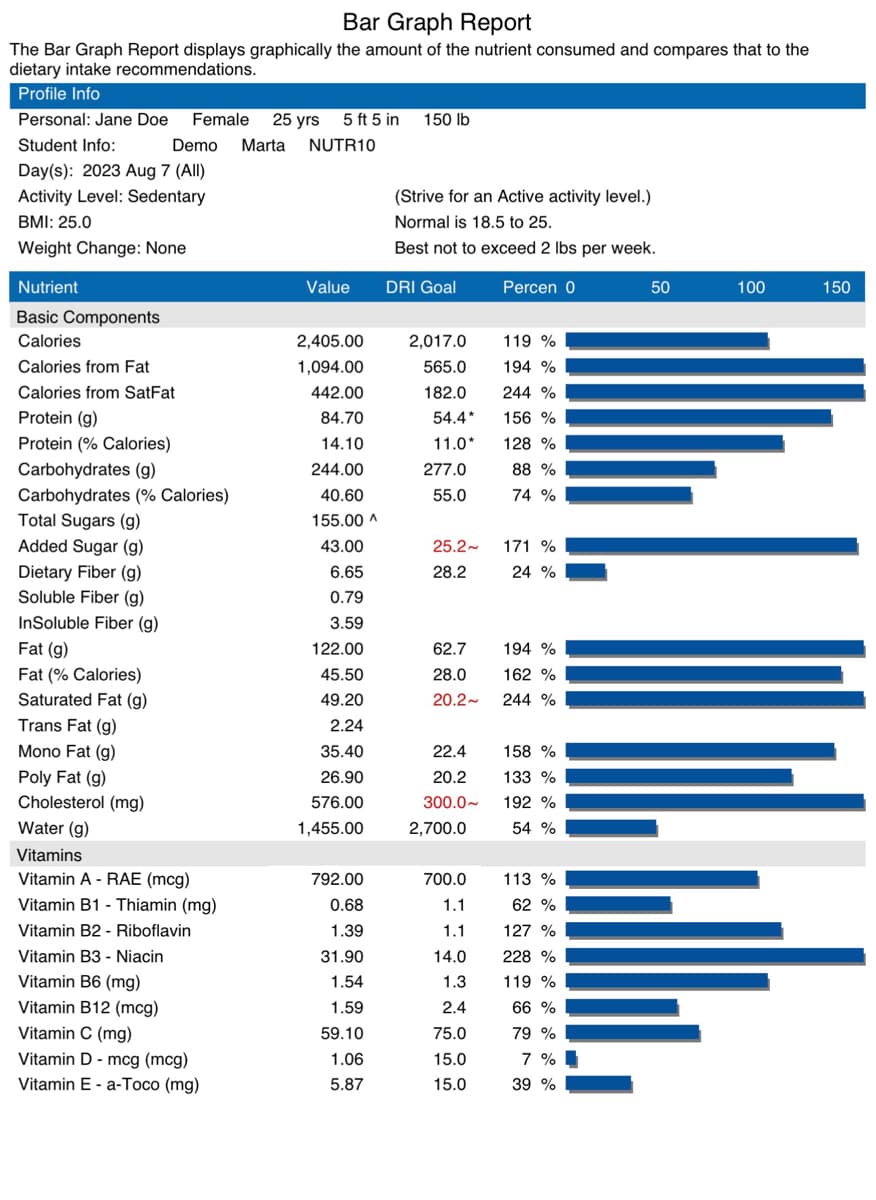
Transcribed Image Text:Bar Graph Report
The Bar Graph Report displays graphically the amount of the nutrient consumed and compares that to the
dietary intake recommendations.
Profile Info
Personal: Jane Doe Female 25 yrs
Student Info:
Demo
Day(s): 2023 Aug 7 (All)
Activity Level: Sedentary
BMI: 25.0
Weight Change: None
Nutrient
Basic Components
Calories
Calories from Fat
Calories from SatFat
Protein (g)
Protein (% Calories)
Carbohydrates (g)
Carbohydrates (% Calories)
Total Sugars (g)
Added Sugar (g)
Dietary Fiber (g)
Soluble Fiber (g)
InSoluble Fiber (g)
Fat (g)
Fat (% Calories)
Saturated Fat (g)
Trans Fat (g)
Mono Fat (g)
Poly Fat (g)
Cholesterol (mg)
Water (g)
Vitamins
Vitamin A - RAE (mcg)
Vitamin B1 - Thiamin (mg)
Vitamin B2- Riboflavin
Vitamin B3 - Niacin
Vitamin B6 (mg)
Vitamin B12 (mcg)
Vitamin C (mg)
Vitamin D - mcg (mcg)
Vitamin E-a-Toco (mg)
5 ft 5 in
Marta NUTR10
Value
2,405.00
1,094.00
442.00
84.70
14.10
244.00
40.60
155.00 A
43.00
6.65
0.79
3.59
122.00
45.50
49.20
2.24
35.40
26.90
576.00
1,455.00
792.00
0.68
1.39
31.90
1.54
1.59
59.10
1.06
5.87
150 lb
(Strive for an Active activity level.)
Normal is 18.5 to 25.
Best not to exceed 2 lbs per week.
DRI Goal
Percen 0
2,017.0
565.0
182.0
54.4*
11.0*
277.0
55.0
25.2~
28.2
22.4
20.2
300.0~
2,700.0
119 %
194 %
244 %
156 %
62.7
194 %
28.0
162 %
20.2~ 244 %
700.0
1.1
1.1
14.0
1.3
2.4
75.0
15.0
15.0
128 %
88 %
74 %
171 %
24 %
158 %
133 %
192 %
54 %
113 %
62 %
127 %
228 %
119 %
66 %
79 %
7%
39 %
50
100
150
Expert Solution
This question has been solved!
Explore an expertly crafted, step-by-step solution for a thorough understanding of key concepts.

This is a popular solution!

Trending now
This is a popular solution!

Step by step
Solved in 4 steps
