
Economics:
10th Edition
ISBN: 9781285859460
Author: BOYES, William
Publisher: Cengage Learning
expand_more
expand_more
format_list_bulleted
Question
thumb_up100%
Chapter 21, Problem 1E
To determine
(a)
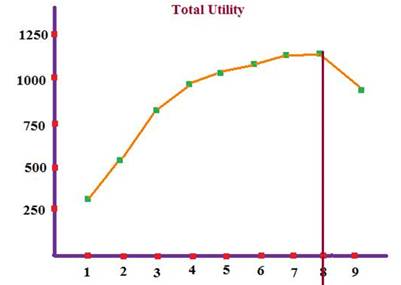
Graphical representation of total utility.
Expert Solution
Explanation of Solution
| No. of utils | Total Utility | |
| 1st | 300 | 300 |
| 2nd | 250 | 550 |
| 3rd | 220 | 770 |
| 4th | 160 | 930 |
| 5th | 100 | 1030 |
| 6th | 50 | 1080 |
| 7th | 20 | 1100 |
| 8th | 0 | 1100 |
| 9th | -250 | 850 |
Economics Concept Introduction
Total Utility is defined as the aggregate of total satisfaction that a consumer consumes for a specific good or service.
Marginal utility is defined as the addition to the total utility which is derived after consuming an additional unit.
To determine
(b)
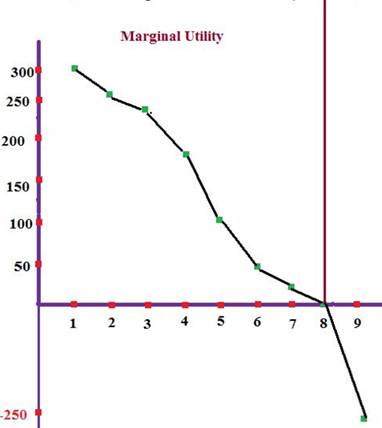
Graphical representation of Marginal utility.
Expert Solution
Explanation of Solution
Economics Concept Introduction
Marginal utility is the addition to total utility when one more unit of good is consumed.
To determine
(c)
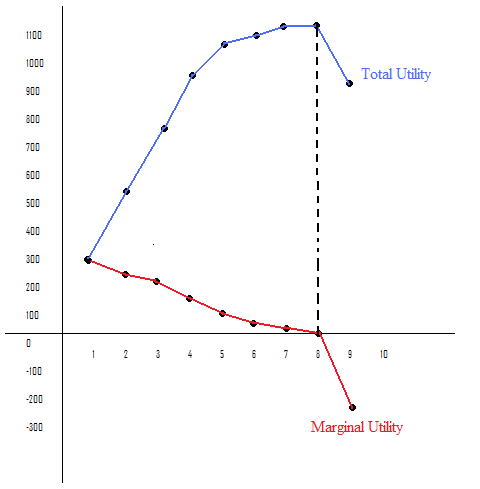
Marginal utility value at which total utility reach a maximum.
Expert Solution
Explanation of Solution
At 8TH unit, total utility is at its maximum and marginal utility is 0.
Economics Concept Introduction
Marginal utility is the addition to total utility when one more unit of good is consumed.
Want to see more full solutions like this?
Subscribe now to access step-by-step solutions to millions of textbook problems written by subject matter experts!
Students have asked these similar questions
Number of Units
1
23
4
5
6
Total
Utility
40
80
140
182
222
230
Refer to the table. What is the marginal utility of the third unit?
Table 6.4
Chocolate Bars
Total Utility
1
10
2
25
3
4
60
5
70
Refer to Table 6.4, which shows a utility schedule for a consumer’s consumption of chocolate bars. The total utility derived from the consumption of one chocolate bar is _____ units.
Group of answer choices
70
10
2
45
15
explain
Knowledge Booster

Similar questions
- The following table reflects the utility one receives from consuming a given product. Units Consumed Total Utility (TU) Marginal Utility (MU) 0 0 ------- 1 60 60 2 ____ 50 3 150 ____ 4 175 ____ 5 ____ 20 6 210 ____ Complete the table solving for the missing total utility or marginal utility values in each row. Total utility increases throughout the table. What rate does total utility increase? In other words, is it rising at an increasing rate, a…arrow_forward15. Answer the following questions based on the table. a) Complete the given table. b) Draw the total and marginal utility curves from the complete table. c) Show the relationship between total and marginal utility curves. Units of goods Total Utility(TU) Marginal Utility (MU) 1 5 2 9 3 12 4 14 5 15 6. 15 7 14arrow_forwardQuestion 9arrow_forward
- 3. Given the following box, calculate marginal utility. Plot total and marginal utility. Units of Good X Total Utility Marginal Utility 1 10 19 3 27 4 34 5 40arrow_forwardThe total utility schedule of Sharon is given below for the number of shoes she consumes. i. Calculate Sharon’s marginal utility schedule. ii. Plot a graph of total and marginal utility.iii. What is the maximum number of shoes that Sharon will consume? Explainarrow_forwardNonearrow_forward
- 1. What is the Total Utility of the second unit? 2. What is the Marginal utility of the third, fourth and the fifth unit? 3. Explain the relationship between Total Utility and Marginal Utility. 4. At which rate is total utility increasing: a constant rate, a decreasing rate, or an increasing rate? How do you know? 5. “It is possible that a rational consumer will not purchase any units of the product represented by these data.” Do you agree? Explain why or why not. 6. In the last decade or so there has been a dramatic expansion of small retail convenience stores (such as 7 Eleven, Kwik Shop, and Circle K), although their prices are generally much higher than prices in large supermarkets. What explains the success of the convenience stores?arrow_forwardChoose the best answer using the utility chart below.  What is the total utility for five snow cones? A. 50 B. 60 C. 45 D. 75arrow_forwardThe following table shows the total utility gained from the consumption of Fanta Lemon in a week. Quantity 1 2 3 4 5 6 7 Total utility 20 35 45 53 58 58 48 (i) Calculate the marginal utility. What do you observe? (ii) Sketch the total utility and marginal utility curves. (iii) If the price of Fanta Lemon increases from `Rs.8 to `Rs.10, how will it affect its consumption? Explain your answer using the data above.arrow_forward
- 2arrow_forwardqty per week Marginal Utility of songs Marginal Utility of Cookies 1 15 25 13 20 3 12 16 4 11 13 10 11 6. 9 10 7 8. 7 8. 6. 7 10 Above is the utility of Sara for song and cookie consumption. If the price of a song is $2 and the price of a cookie is $1, how many cookies and songs will sara consumer? Why?arrow_forwardTotal Utility Total Utility 0 0 15 25 30 35 40 43 48 46 5 55 5 48 Refer to Table 6-3. The table shows Moira's total utility from each chocolate bar and cup of hot chocolate that she consumes. Which cup of hot chocolate has the highest marginal utility? the first the second the fourth the fifth Quantity 0 1 2 3 4 Quantity 0 1 3arrow_forward
arrow_back_ios
SEE MORE QUESTIONS
arrow_forward_ios
Recommended textbooks for you


 Economics (MindTap Course List)EconomicsISBN:9781337617383Author:Roger A. ArnoldPublisher:Cengage Learning

Economics (MindTap Course List)
Economics
ISBN:9781337617383
Author:Roger A. Arnold
Publisher:Cengage Learning