...) The figure below shows contours of g(x, y) on the region R, with 9 < x < 15 and 2 < y < 8. 7 6 11 13 15
...) The figure below shows contours of g(x, y) on the region R, with 9 < x < 15 and 2 < y < 8. 7 6 11 13 15

Algebra & Trigonometry with Analytic Geometry
13th Edition
ISBN:9781133382119
Author:Swokowski
Publisher:Swokowski
Chapter9: Systems Of Equations And Inequalities
Section: Chapter Questions
Problem 12T

Related questions
Question
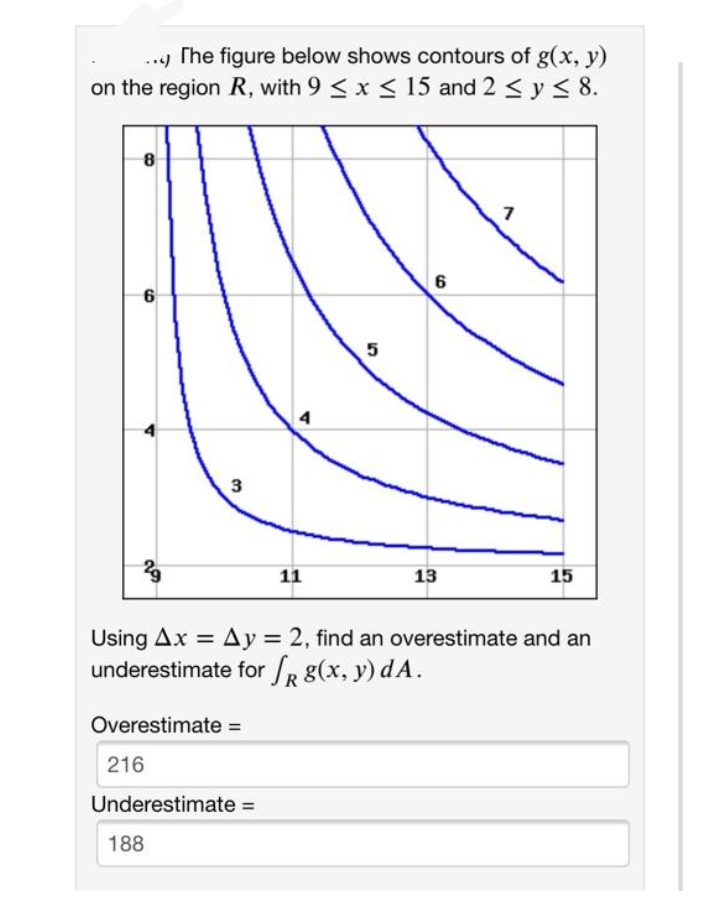
Transcribed Image Text:.) The figure below shows contours of g(x, y)
on the region R, with 9 < x < 15 and 2 < y < 8.
8
6
6
4
11
13
15
Using Ax = Ay = 2, find an overestimate and an
underestimate for R g(x, y) dA.
Overestimate =
216
Underestimate =
188
Expert Solution
This question has been solved!
Explore an expertly crafted, step-by-step solution for a thorough understanding of key concepts.

This is a popular solution!

Trending now
This is a popular solution!

Step by step
Solved in 2 steps

Knowledge Booster


Learn more about
Need a deep-dive on the concept behind this application? Look no further. Learn more about this topic, advanced-math and related others by exploring similar questions and additional content below.Recommended textbooks for you
Algebra & Trigonometry with Analytic Geometry
Algebra
ISBN:
9781133382119
Author:
Swokowski
Publisher:
Cengage
Algebra & Trigonometry with Analytic Geometry
Algebra
ISBN:
9781133382119
Author:
Swokowski
Publisher:
Cengage