0 10 20 30 40 Year 50 60 70 80 1963 1990 1995 2000 2005 2011 62.328 58.193 55.773 53.345 44.421 a. Consider 1940 to be year 0 and use regression to find a quadratic equation to model the data. Round the numbers in your equation to 3 decimal places. y = Preview b. It is clear in the table that circulation was at 50 (thousand) between 1945 and 1950, then again between 2005 and 2011. Use your equation to find the years, accurate to 1 decimal place. Separate your answers with a comma. c. Use your equation to predict the year the circulation will drop to 25 (thousand), accurate to 1 decimal place.
0 10 20 30 40 Year 50 60 70 80 1963 1990 1995 2000 2005 2011 62.328 58.193 55.773 53.345 44.421 a. Consider 1940 to be year 0 and use regression to find a quadratic equation to model the data. Round the numbers in your equation to 3 decimal places. y = Preview b. It is clear in the table that circulation was at 50 (thousand) between 1945 and 1950, then again between 2005 and 2011. Use your equation to find the years, accurate to 1 decimal place. Separate your answers with a comma. c. Use your equation to predict the year the circulation will drop to 25 (thousand), accurate to 1 decimal place.

Glencoe Algebra 1, Student Edition, 9780079039897, 0079039898, 2018
18th Edition
ISBN:9780079039897
Author:Carter
Publisher:Carter
Chapter4: Equations Of Linear Functions
Section: Chapter Questions
Problem 2SGR

Related questions
Question
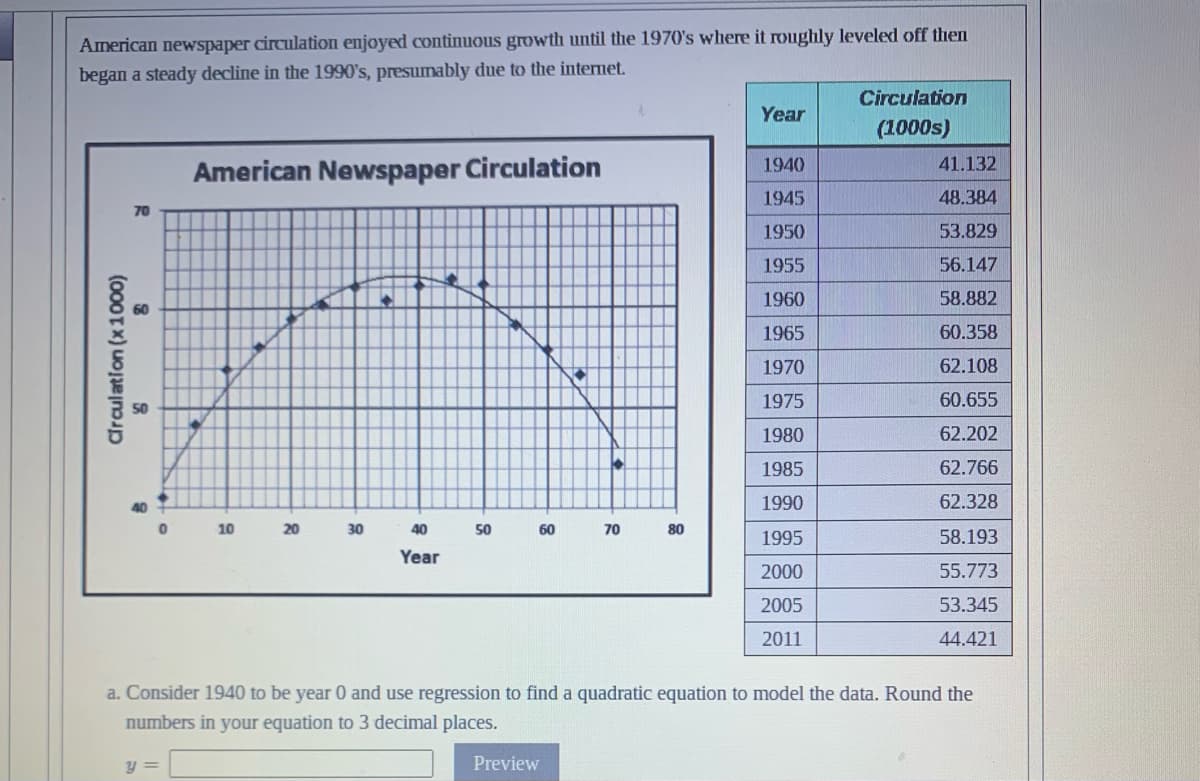
Transcribed Image Text:American newspaper circulation enjoyed continuous growth until the 1970's where it roughly leveled off then
began a steady decline in the 1990's, presumably due to the internet.
Circulation (x1000)
70
60
50
40
0
y =
American Newspaper Circulation
10
20
30
40
Year
A
50
60
Preview
↓
70
80
Year
1940
1945
1950
1955
1960
1965
1970
1975
1980
1985
1990
1995
2000
2005
2011
Circulation
(1000s)
a. Consider 1940 to be year 0 and use regression to find a quadratic equation to model the data. Round the
numbers in your equation to 3 decimal places.
41.132
48.384
53.829
56.147
58.882
60.358
62.108
60.655
62.202
62.766
62.328
58.193
55.773
53.345
44.421
Transcribed Image Text:0
10
20
30
40
Year
50
60
70
80
1963
1990
1995
2000
2005
2011
62.328
58.193
55.773
53.345
44.421
a. Consider 1940 to be year 0 and use regression to find a quadratic equation to model the data. Round the
numbers in your equation to 3 decimal places.
y =
Preview
b. It is clear in the table that circulation was at 50 (thousand) between 1945 and 1950, then again between 2005
and 2011. Use your equation to find the years, accurate to 1 decimal place. Separate your answers with a
comma.
c. Use your equation to predict the year the circulation will drop to 25 (thousand), accurate to 1 decimal place.
Expert Solution
This question has been solved!
Explore an expertly crafted, step-by-step solution for a thorough understanding of key concepts.

This is a popular solution!

Trending now
This is a popular solution!

Step by step
Solved in 3 steps with 3 images

Recommended textbooks for you
Glencoe Algebra 1, Student Edition, 9780079039897…
Algebra
ISBN:
9780079039897
Author:
Carter
Publisher:
McGraw Hill


Glencoe Algebra 1, Student Edition, 9780079039897…
Algebra
ISBN:
9780079039897
Author:
Carter
Publisher:
McGraw Hill

Algebra & Trigonometry with Analytic Geometry
Algebra
ISBN:
9781133382119
Author:
Swokowski
Publisher:
Cengage