1 2. Given the graph of y = f (x), sketch a clearly labelled graph of y = f (x) on the same set of axes. y = f (x) 5- 3- 2- -2 -1 1 2 3 6 7 8 9 -3
1 2. Given the graph of y = f (x), sketch a clearly labelled graph of y = f (x) on the same set of axes. y = f (x) 5- 3- 2- -2 -1 1 2 3 6 7 8 9 -3

Algebra & Trigonometry with Analytic Geometry
13th Edition
ISBN:9781133382119
Author:Swokowski
Publisher:Swokowski
Chapter3: Functions And Graphs
Section3.5: Graphs Of Functions
Problem 59E

Related questions
Question
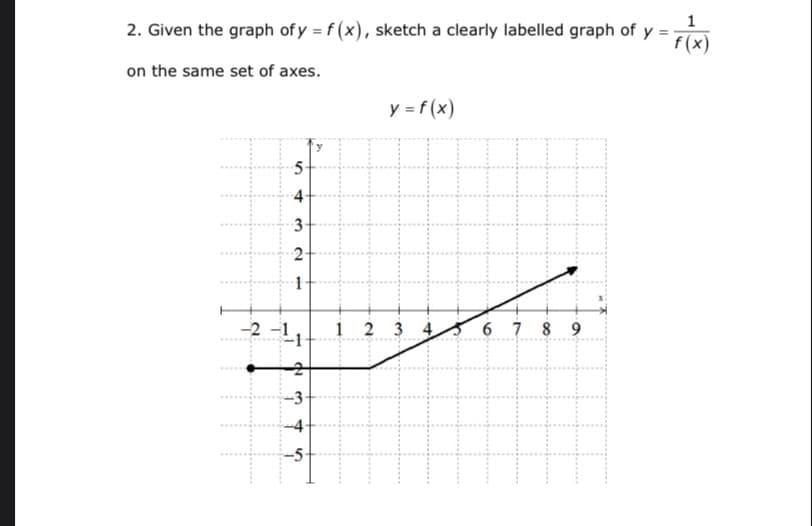
Transcribed Image Text:2. Given the graph of y = f (x), sketch a clearly labelled graph of y =
f(x)
on the same set of axes.
y = f (x)
5-
4
3
2-
-2 -1
1 2 3 4
6 7 8 9
Expert Solution
This question has been solved!
Explore an expertly crafted, step-by-step solution for a thorough understanding of key concepts.

This is a popular solution!

Trending now
This is a popular solution!

Step by step
Solved in 2 steps with 2 images

Recommended textbooks for you
Algebra & Trigonometry with Analytic Geometry
Algebra
ISBN:
9781133382119
Author:
Swokowski
Publisher:
Cengage
Algebra & Trigonometry with Analytic Geometry
Algebra
ISBN:
9781133382119
Author:
Swokowski
Publisher:
Cengage