1 frame per second x (m) 1200 200 400 600 800 1000 FIGURE P2.1 TABLE 2.1 Measured positions of a student walking to school Time Position Time Position t (min) x (m) t (min) x (m) 5 220 1 60 6 240 2 120 7 340 180 8 440 4 200 9. 540 3.
1 frame per second x (m) 1200 200 400 600 800 1000 FIGURE P2.1 TABLE 2.1 Measured positions of a student walking to school Time Position Time Position t (min) x (m) t (min) x (m) 5 220 1 60 6 240 2 120 7 340 180 8 440 4 200 9. 540 3.

Related questions
Question
Shown is a motion diagram of a car traveling down a street. The camera took one frame every second. A distance scale is provided.
a. Use the scale to determine the x-value of the car at each dot. Place your data in a table, similar to Table 2.1, showing each position and the instant of time at which it occurred.
b. Make a graph of x versus t, using the data in your table. Because you have data only at certain instants of time, your graph should consist of dots that are not connected together.
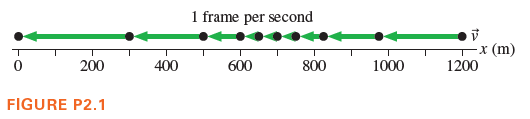
Transcribed Image Text:1 frame per second
x (m)
1200
200
400
600
800
1000
FIGURE P2.1
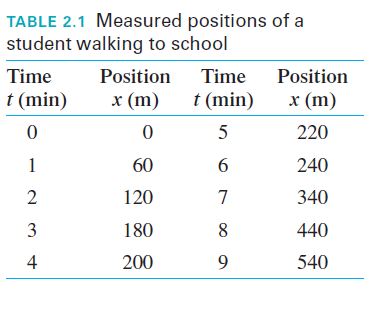
Transcribed Image Text:TABLE 2.1 Measured positions of a
student walking to school
Time
Position
Time
Position
t (min)
x (m)
t (min)
x (m)
5
220
1
60
6
240
2
120
7
340
180
8
440
4
200
9.
540
3.
Expert Solution
This question has been solved!
Explore an expertly crafted, step-by-step solution for a thorough understanding of key concepts.

This is a popular solution!

Trending now
This is a popular solution!

Step by step
Solved in 2 steps with 1 images
