

Q: 4 Graph the line with slope and y-intercept -2. 3 -6 4.
A:
Q: 1 Graph the line with slope and y-intercept - 6. 3
A: topic - sketch of line with given slope and y intercept y decreases by 1unit for every 3 unit rise…
Q: 1 Graph the line with slope and y-intercept -5. 3.
A:
Q: Find the line's slope and a point on the line. y+3 3= (r-5) slope: Undefined point on the line: .D
A:
Q: The horizontal line with y-intercept 5
A: The slope (m) of a horizontal line is: m = 0 The y-intercept (c) is: c = 5
Q: a) What is the slope of a line perpendicular to the graph of y-X-6? b) Graph y -x-6? %3D c) Graph a…
A:
Q: 9. What is most likely the slope of the line graphed? y A. -2 B. 0 C. 2 D. undefined
A: A line parallel to y Axis is given and we have to find it's slope.
Q: 4. How can the slope be interpreted? 5. What is the y-intercept of the line? 6. What does the…
A: Given : The data of enrollment in past ten years, to evaluate the slope and y-intercept.
Q: 31. Graph the line with a slope of -4 and passing through the point P(-5, 3).
A: Graph of a line having slope -4 & passing through the point P(-5,3).
Q: In Problem,graph the line containing the point P and having slope m. P…
A: First we will find the equation of line that passes through the point (2,1) and slope m=4.
Q: Estimate the slope of the line from its graph.
A: From the graph,
Q: In Problem ,find the slope and y-intercept of each line.Graph the line. 1/2y = x-1
A:
Q: Find the equation of the line with the given description. Slope 3, x-intercept 6
A: Given that, Slope of the line = 3 x-intercept = 6 Let the two-intercept form of the line be: x6+yb=1…
Q: the line with slope
A:
Q: 4 Graph the line that contains the point (2, 4) and has a slope of 3. y 5. 4. 3- 2 -6-5 -4-3 -2 -1 0…
A:
Q: Find the equation of the line with the given description. Slope 3, y-intercept 8
A: Given that slope = m =3 And y-intercept = b=8
Q: y 5 -5 -4 -3 -2 -1 3. -1 -2 -3 ghts reserved. 2.
A:
Q: 8. Graph the line with the slope and y-intercept -2. 3 a. C. 4+ 3+ +++ 5 4 -3 -2 -1 2 13 -2 -3-
A:
Q: 17. Determine the slope-intercept from of the line from the graph. Reproduce the graph in your…
A: Slope - intercept form of equation of line is. y = m x + c here c is a y - intercept .
Q: In Problem ,find the slope and y-intercept of each line.Graph the line. x + y =…
A: Given- x+y=1 To Find- the slope and y-intercept of above line and graph the line. Identity Used-…
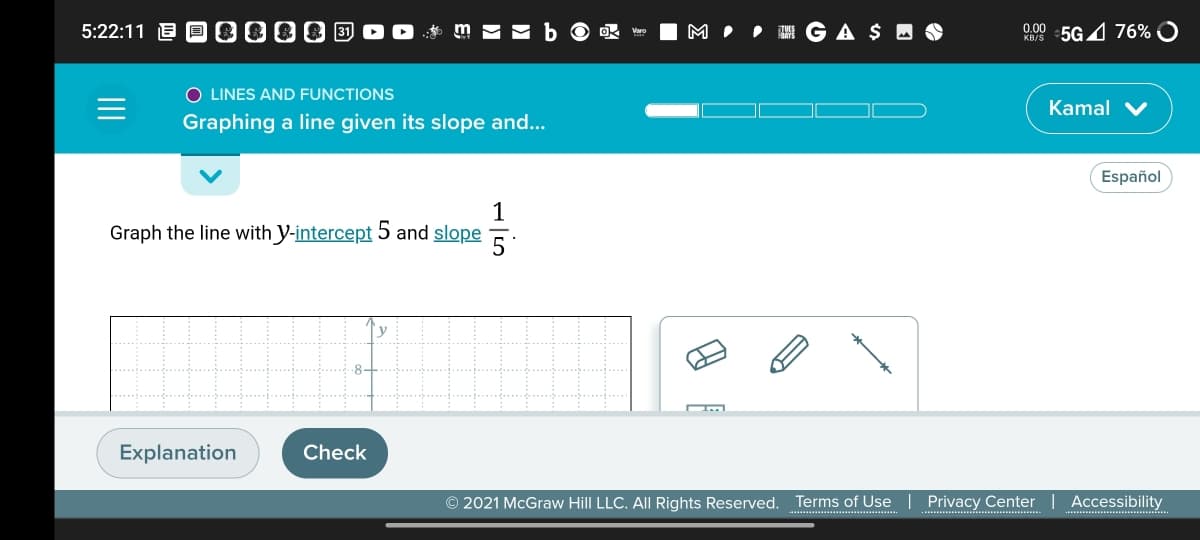
Q: 3 Graph the line with y-intercept 6 and slope 5
A: Given, y -intercept = 6 and slope = -35
Q: Find the slope and the y-intercept (if possible) of the line y = −1
A:
Q: Ay M 3.
A:
Q: the line with the slope of 1/5 and passing through the point D(2,2)
A: Consider a line with a slope of 15 and passes through the point D2,2. The equation of the line with…
Q: 1 Graph the line with y-intercept – 1 and slope 5
A: If the y-intercept of the line is c and slope is m, then the equation of the line is y=mx+c For the…
Q: In Problem,graph the line containing the point P and having slope m. P =(1, 2); m =…
A: Given: P=(1,2)m=3
Q: 3 -2 -1 3. -2 -D3 1. す
A: Remark: slope of the line passing through two points (x1, y1) and (x2, y2) is given by m = (y2 -…
Q: Find the point on the Curve y =-3X that has a slope of -3 10
A: Given:
Q: In Problem ,find the slope and y-intercept of each line.Graph the line. x - y = 2
A: Slope of x-y=2:m=1 Slope-Intercept form of x-y=2:Axis interception points of x-2: X Intercepts:…
Q: 1) Identify the slope and y-intercept from the graph. Slope = %3D -2 y-intercept = %3D -2 2.
A: We have to find out
Q: In Problem ,find the slope and y-intercept of each line.Graph the line. y=5
A: Given: Equation of line y=5 To find: 1) Slope 2) y-intercept 3) Graph of…
Q: Españo 1 1 Graph the line with y-intercept 6 and slope 3
A:
Q: Find the line's slope and a point on the line. y-4= (++1) slope: || Undefined point on the line: (D*
A: We have given equation of the line y-4=13x+1 y=x3+13+4 y=x3+1+123 y=x3+133 ..........(i) Comparing…
Q: What is the slope of the line shown on the graph? * Ay 10- 8- 6- 4- 2- X |-10 -8 -6 -4 -2 -24 2 4 6…
A:
Q: 1. What is the slope of the following graph? y 小Y "כ- ד- TTX +4--+ 543-2 - 2 $ 4 5 +-2 -3--- +-1 -…
A: Topic : Coordinate Geometry slope = 2
Q: 5 Graph the line passing through (4, 6) whose slope is m 2
A: Given that Point(4,6) slope =-5/2
Q: Which of the following represents the graph of The line with y-intecept 7 and slope 100 The line…
A: Solution: Given: y=100x-7 Compare with y= mx+c where m is slope and c is the y- intercept m=100 and…
Q: 2. Find the slope of the line graphed below. (TEKS 3A) m =
A:
Q: The line with a slope 1/3 that goes through the point (0,5)
A:
Q: Find an equation of the line that satisfies the given conditions. Slope 2/5; y-intercepts 4
A: Given : Slope = 25 and y - intercepts = 4 .
Q: What are the slope and y-intercept of the graph? Om- 2.5.b--5 Om=-5.b-2.5 Om--2.5. b =-5 Om--2.5. b…
A: The given points are, (-4,5) and (1,-7.5)
Q: 5 Find the equation of the line with y-intercept 7 and slope 9 ||
A:
Q: Graph the line with slope 5 and y-intercept-3.
A: Given that the line with slope 5 and y- intercept is -3. Then we have to draw the graph.
Q: If a line passing through (-4,3) cuts off the smallest area from the second quadrant in a coordinate…
A:
Q: Learn with an Graph this line using the slope and y-intercept: y = * +2
A:
Q: 1 slope:; y-intercept: 2.
A: Solution: The objective is to write an equation in the form slope and y-intercept
Q: Graph the line containing the point P and having slope m. P = ( 0,3) ; slope undefined
A: Given: P=0,3, slopem=undefinedWe know that equation of line which passes through pointa,b and slope…
Q: a) A line with a slope of 4 and y-intercept-6.
A: Since you have asked multiple question, we will solve the first question for you as per our guide…
Q: 1) The slope of a horizontal line is
A: Thanks for the question :)And your upvote will be really appreciable ;), as per guideline , one…

Step by step
Solved in 3 steps with 3 images

- Refer to the following computer output from estimating the parameters of the nonlinear model Y = aRbScTd The computer output from the regression analysis is: DEPENDENT VARIABLE: LNY R-SQUARE F-RATIO P-VALUE ON F OBSERVATIONS: 32 0.7766 32.44 0.0001 VARIABLE PARAMETER ESTIMATE STANDARD ERROR T-RATIO P-VALUE INTERCEPT -0.6931 0.32 -2.17 0.0390 LNR 4.66 1.36 3.43 0.0019 LNS -0.44 0.24 -1.83 0.0774 LNT 8.28 4.60 1.80 0.0826 Based on the information in the table, if R = 1, S = 2, and T = 3, what value do you expect Y will have?Refer to the following computer output from estimating the parameters of the nonlinear model Y = aRbScTd The computer output from the regression analysis is: DEPENDENT VARIABLE: LNY R-SQUARE F-RATIO P-VALUE ON F OBSERVATIONS: 32 0.7766 32.44 0.0001 VARIABLE PARAMETER ESTIMATE STANDARD ERROR T-RATIO P-VALUE INTERCEPT -0.6931 0.32 -2.17 0.0390 LNR 4.66 1.36 3.43 0.0019 LNS -0.44 0.24 -1.83 0.0774 LNT 8.28 4.60 1.80 0.0826 Based on the information in the table, if S increases by 8% (all other things constant), Y will MultipleRefer to the following computer output from estimating the parameters of the nonlinear model Y = aRbScTd The computer output from the regression analysis is: DEPENDENT VARIABLE: LNY R-SQUARE F-RATIO P-VALUE ON F OBSERVATIONS: 32 0.7766 32.44 0.0001 VARIABLE PARAMETER ESTIMATE STANDARD ERROR T-RATIO P-VALUE INTERCEPT -0.6931 0.32 -2.17 0.0390 LNR 4.66 1.36 3.43 0.0019 LNS -0.44 0.24 -1.83 0.0774 LNT 8.28 4.60 1.80 0.0826 Based on the information in the table, which of the parameter estimates are statistically significant at the 90% level of confidence?
- Test the null hypothesis that the slope is zero versus the two-sided alternative in the following setting using the alpha=0.05 signifiance level. n=20, yhat=28.5+1.4x, and SEb1=0.65Snowpacks contain a wide spectrum of pollutants thatmay represent environmental hazards. The article“Atmospheric PAH Deposition: Deposition Velocitiesand Washout Ratios” (J. of EnvironmentalEngineering, 2002: 186–195) focused on the depositionof polyaromatic hydrocarbons. The authors proposeda multiple regression model for relating depositionover a specified time period (y, in mg/m2) to tworather complicated predictors x1 (mg-sec/m3) and x2 (mg/m2), defined in terms of PAH air concentrations forvarious species, total time, and total amount of precipitation.Here is data on the species fluoranthene andcorresponding Minitab output:obs x1 x2 flth1 92017 .0026900 278.782 51830 .0030000 124.533 17236 .0000196 22.654 15776 .0000360 28.685 33462 .0004960 32.666 243500 .0038900 604.707 67793 .0011200 27.698 23471 .0006400 14.189 13948 .0004850 20.6410 8824 .0003660 20.6011 7699 .0002290 16.6112 15791 .0014100 15.0813 10239 .0004100 18.0514 43835 .0000960 99.7115 49793 .0000896 58.9716 40656…Refer to the following nonlinear model which relates W to P, Q, and R: W = aPbQcRd The computer output form the regression analysis is: DEPENDENT VARIABLE: LNW R-SQUARE F-RATIO P-VALUE ON F OBSERVATIONS: 18 0.9023 43.12 0.0001 VARIABLE PARAMETER ESTIMATE STANDARD ERROR T-RATIO P-VALUE INTERCEPT 2.50 0.45 5.56 0.0001 LNP -5.10 1.75 -2.91 0.0113 LNQ 12.40 3.20 3.88 0.0017 LNR -6.00 1.50 -4.00 0.0010 Based on the information in the table, the nonlinear relation can be transformed into the following linear regression model:
- Jóhannes plans to examine the salary of a middle manager in a large company. He collects data on salaries and how long they have been employed as middle managers with the aim of creating a model that can predict salaries with work experience. Jóhannes has data from 20 randomly selected middle managers who range from being new to the job to having 12 years of work experience. Jóhannes started by drawing the data and sees that the relationship is linear. He also calculates some light sizes that can be seen below: Convert Average Standard deviation Salary 761041 238473 Job experience 5,65 3,71 He also calculated the correlation coefficient between wages and work experience and obtained a r = 0.82. a) Find an equal regression line for Jóhannes's modelb) What is the explanatory power of the model and what does it tell us?c) How much does a middle manager's salary increase in five years according to the model?d) Use the model to predict the salary of a middle manager with 20 years…Use Excel to develop a regression model for the Consumer Food Database (using the “Excel Databases.xls” file on Blackboard) to predict Annual Food Spending by Annual Household Income. Which observations, if any, are considered to be outliers in this dataset? (i.e. outside 3 se) Select all that apply. There are no outliers in this dataset Observation 3 Observation 127 Observation 151 Annual Food Spending ($) Annual Household Income ($) Non mortgage household debt ($) Region: 1 = NE 2 = MW 3 = S 4 = W Location: 1 = Metro 2 = Outside Metro 8909 56697 23180 1 1 5684 35945 7052 1 1 10706 52687 16149 1 1 14112 74041 21839 1 1 13855 63182 18866 1 1 15619 79064 21899 1 1 2694 25981 8774 1 1 9127 57424 15766 1 1 13514 72045 27685 1 1 6314 38046 8545 1 1 7622 52408 28057 1 1 4322 41405 6998 1 1 3805 29684 4806 1 1 6674 49246 13592 1 1 7347 41491 4088 1 1 2911…The amount of time a student devotes to class attendance and revision: and the grade obtained are assumed to be linearly related. In a small class of 15 students, the following results were obtained for this linear relationship. Y = 30 +2.50.Y (0.55) (2.96) R'= 0.85 The standard errors are in parenthesis. a,Test the hypothesis that the intereept and slope are individually equal to zero (0) at the S% level of signiticance. (b) Construct n 95% conlidence interval for the true slope. (c)Compute the elasticity of grades with respect to time input and interpret your results. (d) Interpret your R' and explain how it relates to the slope of the regression line. (e) From the results and your answers in (a) to (d), does time input into class attendance and revision really influence the final grade?
- A scientist claims that there is a linear relationship between a lake’s flow rate and its runoff factor. The scientist collected data and used the data to test the claim that there is a linear relationship at a significance level of α=0.05α=0.05. The scientist tested the following hypotheses. H0: β1=0 Ha: β1≠0 The scientist found a p-value of 0.02 for the test. Which of the following is a correct conclusion about the scientist’s claim? A. The null hypothesis is rejected since 0.02<0.05. There is sufficient statistical evidence to suggest that there is a linear relationship between a lake’s flow rate and runoff factor. B. The null hypothesis is not rejected since 0.02<0.05. There is sufficient evidence to suggest that there is a linear relationship between a lake’s flow rate and runoff factor. C. The null hypothesis is rejected since 0.02<0.05. There is not sufficient evidence to suggest that there is a linear relationship between a lake’s flow rate and runoff factor. D.…5.25. Representative data on x = carbonation depth (in millimeters) and y = strength (in megapascals) for a sample of concrete core specimens taken from a particular building were read from a plot in the article “The Carbonation of Concrete Structures in the Tropical Environment of Singapore” (Magazine of Concrete Research [1996]: 293-300): Depth, x 8.0 20.0 20.0 30.0 35.0 40.0 50.0 55.0 65.0 Strength, y 22.8 17.1 21.1 16.1 13.4 12.4 11.4 9.7 6.8 a. Construct a scatterplot. Does the relationship between carbonation depth and strength appear to be linear? Yes, the relationship between carbonation depth and strength appears to be linear however it is a negative linear relation. b. Find the equation of the of the least-squares line.c. What would you predict for strength when carbonation depth is 25 mm?d. Explain why it would not be reasonable to use the least-squares line to predict strength when carbonation depth…Which of the following statements is TRUE? I. In multiple linear regression, there should not be any collinearity among the independent variables. II. In regression the independent variable is predicted by dependent variable. III. The best fit line is the line that minimizes the sum of the residues. a.) I and II b.) I and III c.) II and III d.) I, II, III


