1) plot the diode’s I-V characteristics on a linear scale (ID on the y-axis and VD on the x-axis) 2) [RP4] 3) [RP5]
1) plot the diode’s I-V characteristics on a linear scale (ID on the y-axis and VD on the x-axis) 2) [RP4] 3) [RP5]

Introductory Circuit Analysis (13th Edition)
13th Edition
ISBN:9780133923605
Author:Robert L. Boylestad
Publisher:Robert L. Boylestad
Chapter1: Introduction
Section: Chapter Questions
Problem 1P: Visit your local library (at school or home) and describe the extent to which it provides literature...

Related questions
Question
The circle is below(for D1-1N4148 is 1N4148 Diode). and also there have a table(. Note that the first 3 rows of measurement are obtained when the diode is reverse-biased)
|
Vout_dc (V) |
VD (V) |
ID (μA) |
|
0.51 |
-0.51 |
0.0 |
|
0.23 |
-0.20 |
0.0 |
|
0.10 |
-0.08 |
0.0 |
|
0.00 |
0.00 |
0.0 |
|
0.05 |
0.04 |
0.0 |
|
0.11 |
0.09 |
0.0 |
|
0.17 |
0.15 |
0.1 |
|
0.19 |
0.20 |
0.1 |
|
0.27 |
0.25 |
0.4 |
|
0.32 |
0.30 |
1.6 |
|
0.36 |
0.34 |
3.1 |
|
0.42 |
0.40 |
8.2 |
|
0.46 |
0.42 |
14.3 |
|
0.52 |
0.47 |
28.0 |
Questions:
1) plot the diode’s I-V characteristics on a linear scale (ID on the y-axis and VD on the x-axis)
2) [RP4]
3) [RP5]
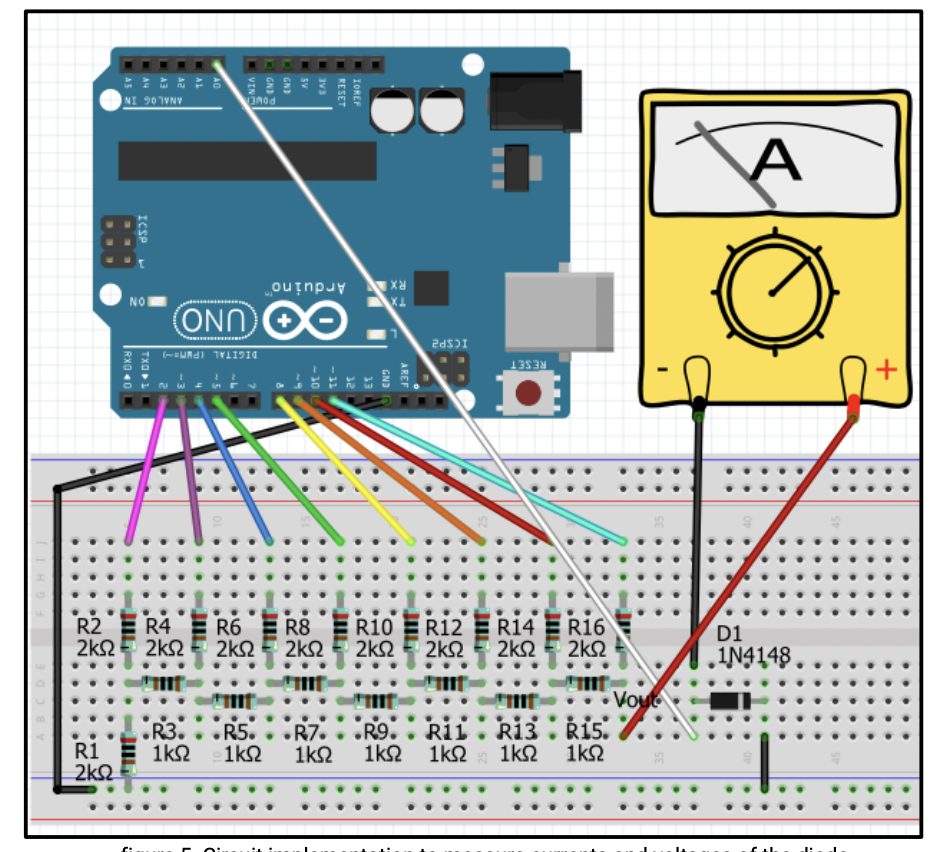
Transcribed Image Text:NI 907VNV
A
RX Arduino"
NO
ONN OO
(UNO
-Und) TYL1914
ICSP2
RESET
::::
R2
2kΩ
R4
2k2
R6
2k2
R8
2k2
R10 ER12 E R14 E R16
2k2
2k2
D1
2k2
2k2
.IN4148.
Vou
R3. . .R5. . R7. . R9. . R11. R13 . Ř15.
1k2
R1
2k2
1k2
1k2
1k2
1k 1k2 1k2
AREF
GND
An
ICSP
RXO 40
![1.4 Obviously, the linear scale on the y-axis makes it hard to understand or model the diode.
You might consider a logarithmic plot to do this. You will replot your data on the y-axis in the log
scale (the grid example is in figure 7 if you plot by hand). If you use MATLAB, run the code and
see plot figure 2 (in MATLAB), blue line.
10
100
10-1
102
103
104
105
10
-0.5
-0.4
-0.3 -0.2
-0.1
0.1
0.2
0.3
0.4
0.5
Figure 7. An empty semilog (log-linear) plot.
1.5 Next, you will fit the theoretical diode model in equation1 below to the measured data.
Use a red color to indicate the diode theoretical equation and blue for the measured data. The
diode follows the relationship in equation 1. Pick Is and VT such that the theoretical diode current
io from equation 1 provides a good approximation of your measured current Ib. Adjusting Is will
shift the curve up and down. Adjusting Vr will change the slope of the curve. You can repeatedly
adjust the value of Is and Vr in MATLAB (line 55 and 56) and replot them until you think both
curves are close.
What is the value of your Is and Vr that makes the ideal diode model fit the experimental l-V
curve [RP4]?
Include in your report a semilog plot that shows the theoretical diode characteristics fitting
the experimental -V curve (with your choice for Is and Vt in RP4) [RP5].
VD
ip = Is(eVr – 1)
Equation 1. Shockley ideal diode equation.
where
İp is the diode current,
Iş is the reverse-bias saturation current (constant),
Vo is the voltage across the diode, and
Vr is the thermal voltage (constant under a certain temperature)](/v2/_next/image?url=https%3A%2F%2Fcontent.bartleby.com%2Fqna-images%2Fquestion%2F099a9854-7cc3-46b9-a37c-ec0486b4a12a%2Ff9801a81-5db9-445d-9c7b-24b95e7a6ad2%2Fv7qm81m_processed.png&w=3840&q=75)
Transcribed Image Text:1.4 Obviously, the linear scale on the y-axis makes it hard to understand or model the diode.
You might consider a logarithmic plot to do this. You will replot your data on the y-axis in the log
scale (the grid example is in figure 7 if you plot by hand). If you use MATLAB, run the code and
see plot figure 2 (in MATLAB), blue line.
10
100
10-1
102
103
104
105
10
-0.5
-0.4
-0.3 -0.2
-0.1
0.1
0.2
0.3
0.4
0.5
Figure 7. An empty semilog (log-linear) plot.
1.5 Next, you will fit the theoretical diode model in equation1 below to the measured data.
Use a red color to indicate the diode theoretical equation and blue for the measured data. The
diode follows the relationship in equation 1. Pick Is and VT such that the theoretical diode current
io from equation 1 provides a good approximation of your measured current Ib. Adjusting Is will
shift the curve up and down. Adjusting Vr will change the slope of the curve. You can repeatedly
adjust the value of Is and Vr in MATLAB (line 55 and 56) and replot them until you think both
curves are close.
What is the value of your Is and Vr that makes the ideal diode model fit the experimental l-V
curve [RP4]?
Include in your report a semilog plot that shows the theoretical diode characteristics fitting
the experimental -V curve (with your choice for Is and Vt in RP4) [RP5].
VD
ip = Is(eVr – 1)
Equation 1. Shockley ideal diode equation.
where
İp is the diode current,
Iş is the reverse-bias saturation current (constant),
Vo is the voltage across the diode, and
Vr is the thermal voltage (constant under a certain temperature)
Expert Solution
This question has been solved!
Explore an expertly crafted, step-by-step solution for a thorough understanding of key concepts.

This is a popular solution!

Trending now
This is a popular solution!

Step by step
Solved in 2 steps with 1 images

Knowledge Booster


Learn more about
Need a deep-dive on the concept behind this application? Look no further. Learn more about this topic, electrical-engineering and related others by exploring similar questions and additional content below.Recommended textbooks for you
Introductory Circuit Analysis (13th Edition)
Electrical Engineering
ISBN:
9780133923605
Author:
Robert L. Boylestad
Publisher:
PEARSON

Delmar's Standard Textbook Of Electricity
Electrical Engineering
ISBN:
9781337900348
Author:
Stephen L. Herman
Publisher:
Cengage Learning

Programmable Logic Controllers
Electrical Engineering
ISBN:
9780073373843
Author:
Frank D. Petruzella
Publisher:
McGraw-Hill Education
Introductory Circuit Analysis (13th Edition)
Electrical Engineering
ISBN:
9780133923605
Author:
Robert L. Boylestad
Publisher:
PEARSON
Delmar's Standard Textbook Of Electricity
Electrical Engineering
ISBN:
9781337900348
Author:
Stephen L. Herman
Publisher:
Cengage Learning
Programmable Logic Controllers
Electrical Engineering
ISBN:
9780073373843
Author:
Frank D. Petruzella
Publisher:
McGraw-Hill Education

Fundamentals of Electric Circuits
Electrical Engineering
ISBN:
9780078028229
Author:
Charles K Alexander, Matthew Sadiku
Publisher:
McGraw-Hill Education

Electric Circuits. (11th Edition)
Electrical Engineering
ISBN:
9780134746968
Author:
James W. Nilsson, Susan Riedel
Publisher:
PEARSON

Engineering Electromagnetics
Electrical Engineering
ISBN:
9780078028151
Author:
Hayt, William H. (william Hart), Jr, BUCK, John A.
Publisher:
Mcgraw-hill Education,