1 The region D above lies between the graphs of y = - 4 - (x + 1) and y = - 8 + (z + 3)*. It It can be describe in two ways. 1. If we visualize the region having "top" and "bottom" boundaries, express each as functions of x and provide the interval of r-values that covers the entire region. "top" boundary g2(x) = "bottom" boundary g1(x) = interval of æ values that covers the region = 2. If we visualize the region having "right" and "left" boundaries, then the "right" boundary must be defined piece-wise. Express each as functions of y for the provided intervals of y-values that covers the entire region. For – 5 < y < – 4 the "right" boundary as a piece-wise function f2(y) = For - 8 < y < - 5 the "right" boundary f2(y) =
1 The region D above lies between the graphs of y = - 4 - (x + 1) and y = - 8 + (z + 3)*. It It can be describe in two ways. 1. If we visualize the region having "top" and "bottom" boundaries, express each as functions of x and provide the interval of r-values that covers the entire region. "top" boundary g2(x) = "bottom" boundary g1(x) = interval of æ values that covers the region = 2. If we visualize the region having "right" and "left" boundaries, then the "right" boundary must be defined piece-wise. Express each as functions of y for the provided intervals of y-values that covers the entire region. For – 5 < y < – 4 the "right" boundary as a piece-wise function f2(y) = For - 8 < y < - 5 the "right" boundary f2(y) =

Algebra & Trigonometry with Analytic Geometry
13th Edition
ISBN:9781133382119
Author:Swokowski
Publisher:Swokowski
Chapter4: Polynomial And Rational Functions
Section: Chapter Questions
Problem 15T

Related questions
Question
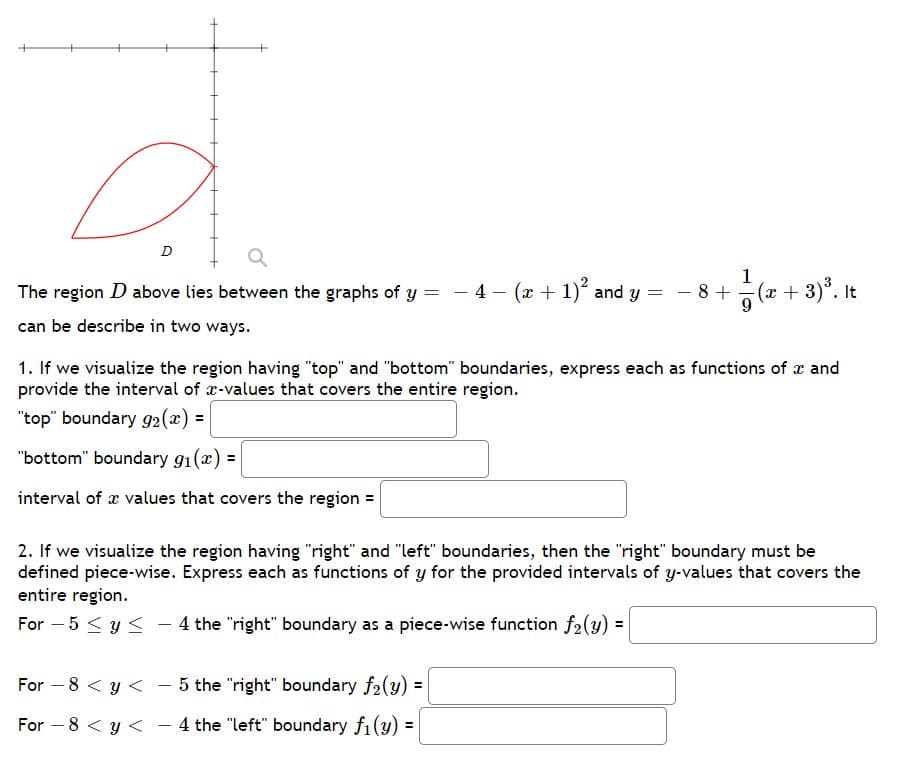
Transcribed Image Text:1
The region D above lies between the graphs of y = - 4 - (x + 1) and y =
- 8 +
(x + 3)*. It
9
can be describe in two ways.
1. If we visualize the region having "top" and "bottom" boundaries, express each as functions of x and
provide the interval of x-values that covers the entire region.
"top" boundary 92(x) =
"bottom" boundary g1(x) =
interval of x values that covers the region =
2. If we visualize the region having "right" and "left" boundaries, then the "right" boundary must be
defined piece-wise. Express each as functions of y for the provided intervals of y-values that covers the
entire region.
For – 5 < y < – 4 the "right" boundary as a piece-wise function f2(y) =
For – 8 < y < - 5 the "right" boundary f2(y) =
For –8 < y < - 4 the "left" boundary f1(y)
%3D
Expert Solution
This question has been solved!
Explore an expertly crafted, step-by-step solution for a thorough understanding of key concepts.

Step by step
Solved in 3 steps with 1 images

Knowledge Booster


Learn more about
Need a deep-dive on the concept behind this application? Look no further. Learn more about this topic, calculus and related others by exploring similar questions and additional content below.Recommended textbooks for you
Algebra & Trigonometry with Analytic Geometry
Algebra
ISBN:
9781133382119
Author:
Swokowski
Publisher:
Cengage

Algebra & Trigonometry with Analytic Geometry
Algebra
ISBN:
9781133382119
Author:
Swokowski
Publisher:
Cengage