1- Title and definition of the variables in the first part. 2- Section for input values. 3- Section to find the quantities that less than the average value of all discharged quantities. 4- Printing the results as a table. 5- Plotting two groups of discharged quantities (first group from one to the middle and the second group from middle to the end value) as two subplots. The plots must include title, axes labels, scaling both axes, use any style color for lines and markers. The code must write using MATLAB editor. Also, each student must take clear pictures to the program and the results (table and the plots), then converted them to a pdf file. The file of the MATLAB program must submit with the answer too. Water discharged 200 320 180 290 370 170 240 255 270 300 230 150 120 280 330 260 (m³/day) Time (day) 1 2 3 4 S 6 7 8 9 10 11 12 13 14 15 16
1- Title and definition of the variables in the first part. 2- Section for input values. 3- Section to find the quantities that less than the average value of all discharged quantities. 4- Printing the results as a table. 5- Plotting two groups of discharged quantities (first group from one to the middle and the second group from middle to the end value) as two subplots. The plots must include title, axes labels, scaling both axes, use any style color for lines and markers. The code must write using MATLAB editor. Also, each student must take clear pictures to the program and the results (table and the plots), then converted them to a pdf file. The file of the MATLAB program must submit with the answer too. Water discharged 200 320 180 290 370 170 240 255 270 300 230 150 120 280 330 260 (m³/day) Time (day) 1 2 3 4 S 6 7 8 9 10 11 12 13 14 15 16

C++ for Engineers and Scientists
4th Edition
ISBN:9781133187844
Author:Bronson, Gary J.
Publisher:Bronson, Gary J.
Chapter2: Problem Solving Using C++using
Section2.5: Variables And Declaration Statements
Problem 8E

Related questions

Question
MATLAB CODE ASAP. ELSEWHERE.
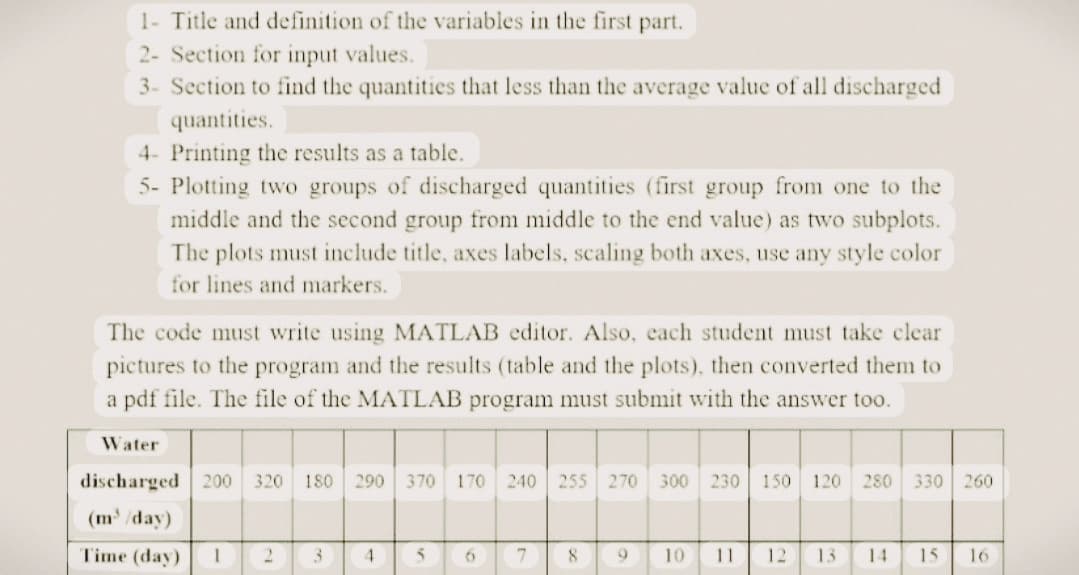
Transcribed Image Text:1- Title and definition of the variables in the first part.
2- Section for input values.
3- Section to find the quantities that less than the average value of all discharged
quantities.
4- Printing the results as a table.
5- Plotting two groups of discharged quantities (first group from one to the
middle and the second group from middle to the end value) as two subplots.
The plots must include title, axes labels, scaling both axes, use any style color
for lines and markers.
The code must write using MATLAB editor. Also, each student must take clear
pictures to the program and the results (table and the plots), then converted them to
a pdf file. The file of the MATLAB program must submit with the answer too.
Water
discharged 200 320 180 290 370 170 240 255 270 300 230 150 120 280
(m³/day)
Time (day)
1 2 3
4
5
6
7
8
10 11
330 260
12 13 14 15 16
Expert Solution
This question has been solved!
Explore an expertly crafted, step-by-step solution for a thorough understanding of key concepts.

Step by step
Solved in 4 steps with 2 images

Knowledge Booster


Learn more about
Need a deep-dive on the concept behind this application? Look no further. Learn more about this topic, computer-science and related others by exploring similar questions and additional content below.Recommended textbooks for you
C++ for Engineers and Scientists
Computer Science
ISBN:
9781133187844
Author:
Bronson, Gary J.
Publisher:
Course Technology Ptr
C++ for Engineers and Scientists
Computer Science
ISBN:
9781133187844
Author:
Bronson, Gary J.
Publisher:
Course Technology Ptr