1. A system has a transfer function (1-s)/(1 +s). It is called (a) low-pass system 2 The following log-magnitude plot of a system represents a (a) PID controller (b) all pass system (c) high-pass system (d) none of these (b) PD controller (c) PI controller (d) Proportional controller CamScanner ligiò uaal 426 Control Systems: Theory and Application ad 11 (00+ XI00 log|G| nigul dollool v lo oitd sohnint qool-god m bea X bail ogu qeobo n noitu lann gool snivad A d bnansupol ning s nd + logoo ie Fig. 1 3. The Bode amplitude plot of a constant is a (a) line with slope-40 dB/decade (c) line with slope +20 dB/decade 4. The pole factor 1/1 + joT has a slope of i (a) 20 dB/decade (b) -20 dB/decade (b) line with slope - 20 dB/ decade (d) straight line parallel to the frequency axis (c) 40 dB/decade (d) -40 dB/decade 5. Gain crossover frequency is the one at which (jo)H(jo| is (a) equal to 1 (b) equal to -1 ot (c) > 1 (d) <-1 6. An octave frequency range is specified by 0, (a) 2=8 (b) (c) od b 0, = 2 (d) 7. The graph corresponds to alan 0° - 90° Phase Se Step E - 180° Step 3 M Step Sp Step 001+ -270° Fig. 2 and (a) minimum phase function (c) non-minimum phase function The transfer function of the system having the Bode plot as shown above is given by (b) all pass function
1. A system has a transfer function (1-s)/(1 +s). It is called (a) low-pass system 2 The following log-magnitude plot of a system represents a (a) PID controller (b) all pass system (c) high-pass system (d) none of these (b) PD controller (c) PI controller (d) Proportional controller CamScanner ligiò uaal 426 Control Systems: Theory and Application ad 11 (00+ XI00 log|G| nigul dollool v lo oitd sohnint qool-god m bea X bail ogu qeobo n noitu lann gool snivad A d bnansupol ning s nd + logoo ie Fig. 1 3. The Bode amplitude plot of a constant is a (a) line with slope-40 dB/decade (c) line with slope +20 dB/decade 4. The pole factor 1/1 + joT has a slope of i (a) 20 dB/decade (b) -20 dB/decade (b) line with slope - 20 dB/ decade (d) straight line parallel to the frequency axis (c) 40 dB/decade (d) -40 dB/decade 5. Gain crossover frequency is the one at which (jo)H(jo| is (a) equal to 1 (b) equal to -1 ot (c) > 1 (d) <-1 6. An octave frequency range is specified by 0, (a) 2=8 (b) (c) od b 0, = 2 (d) 7. The graph corresponds to alan 0° - 90° Phase Se Step E - 180° Step 3 M Step Sp Step 001+ -270° Fig. 2 and (a) minimum phase function (c) non-minimum phase function The transfer function of the system having the Bode plot as shown above is given by (b) all pass function

Introductory Circuit Analysis (13th Edition)
13th Edition
ISBN:9780133923605
Author:Robert L. Boylestad
Publisher:Robert L. Boylestad
Chapter1: Introduction
Section: Chapter Questions
Problem 1P: Visit your local library (at school or home) and describe the extent to which it provides literature...

Related questions
Question
i need the answer quickly
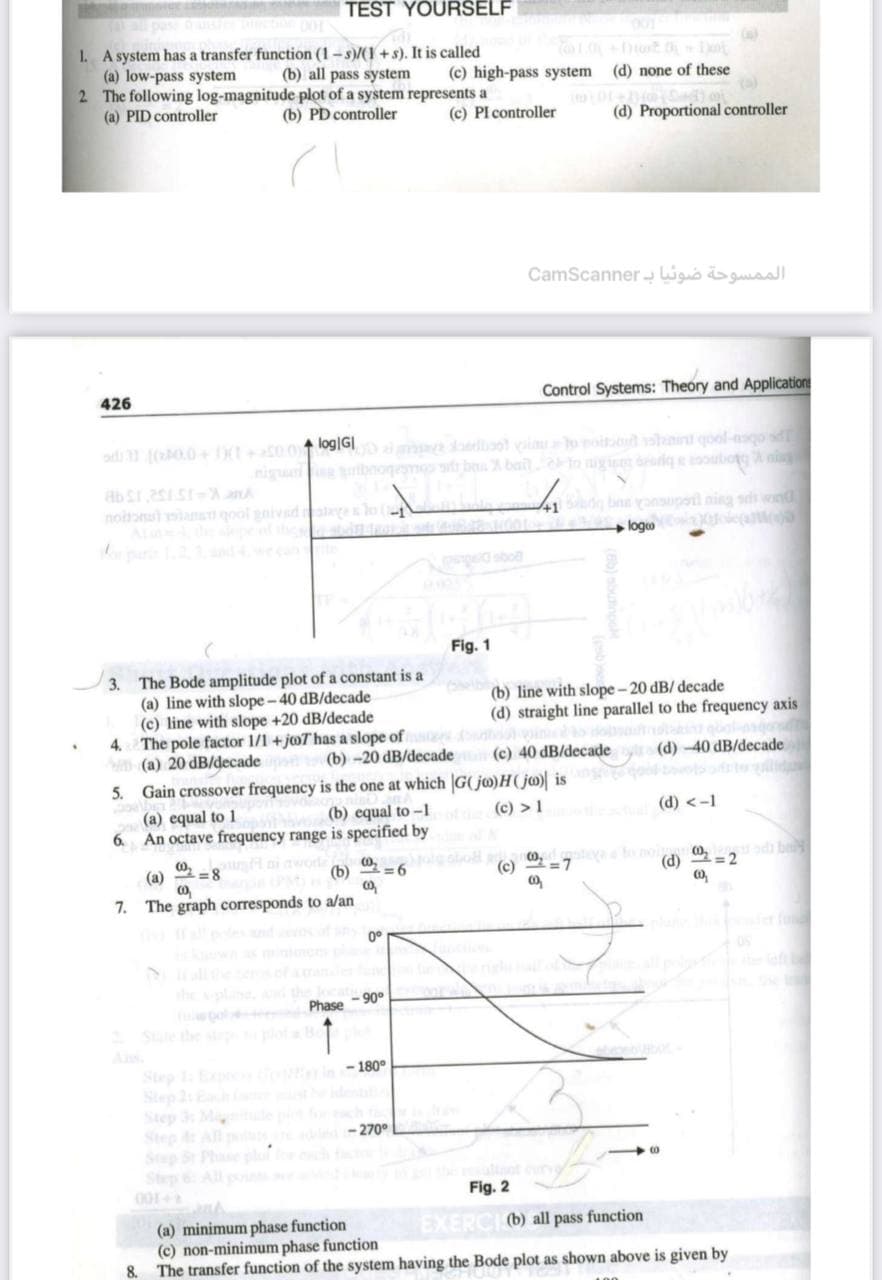
Transcribed Image Text:TEST YOURSELF
1. A system has a transfer function (1-s)/(1 +s). It is called
(a) low-pass system
2 The following log-magnitude plot of a system represents a
(a) PID controller
(b) all pass system
(c) high-pass system (d) none of these
(b) PD controller
(c) PI controller
(d) Proportional controller
CamScanner iguò ɔuaa
426
Control Systems: Theory and Application
adi 1 (0.0+D 0o logiGI llool v o oitd sohint qool-sgo sd
nigui tbnogem bea X bail gu dqeoubotg ni
noiton iam gool pnivsd
Al e
41 bins onsupotl ning sd ond
+ logo iea
Fig. 1
The Bode amplitude plot of a constant is a
(a) line with slope - 40 dB/decade
(c) line with slope +20 dB/decade
4. The pole factor 1/1 + joT has a slope of i
S(a) 20 dB/decade
(b) line with slope - 20 dB/ decade
(d) straight line parallel to the frequency axis
(b) -20 dB/decade
(c) 40 dB/decade
(d) -40 dB/decade
5. Gain crossover frequency is the one at which G(jw)H(j@) is
(b) equal to -1
(a) equal to 1
6. An octave frequency range is specified by
(c) > 1
(d) <-1
(c)
(d)
d b
= 2
(a)
=8
(b)
=D7
7. The graph corresponds to a/an
0°
90°
Phase
- 180°
Step E
Step 2
Step 3 M
Step
Stp
Step
001+
-270°
Fig. 2
(a) minimum phase function
(c) non-minimum phase function
8.
(b) all pass function
The transfer function of the system having the Bode plot as shown above is given by
Expert Solution
This question has been solved!
Explore an expertly crafted, step-by-step solution for a thorough understanding of key concepts.

Step by step
Solved in 2 steps with 1 images

Knowledge Booster


Learn more about
Need a deep-dive on the concept behind this application? Look no further. Learn more about this topic, electrical-engineering and related others by exploring similar questions and additional content below.Recommended textbooks for you
Introductory Circuit Analysis (13th Edition)
Electrical Engineering
ISBN:
9780133923605
Author:
Robert L. Boylestad
Publisher:
PEARSON

Delmar's Standard Textbook Of Electricity
Electrical Engineering
ISBN:
9781337900348
Author:
Stephen L. Herman
Publisher:
Cengage Learning

Programmable Logic Controllers
Electrical Engineering
ISBN:
9780073373843
Author:
Frank D. Petruzella
Publisher:
McGraw-Hill Education
Introductory Circuit Analysis (13th Edition)
Electrical Engineering
ISBN:
9780133923605
Author:
Robert L. Boylestad
Publisher:
PEARSON
Delmar's Standard Textbook Of Electricity
Electrical Engineering
ISBN:
9781337900348
Author:
Stephen L. Herman
Publisher:
Cengage Learning
Programmable Logic Controllers
Electrical Engineering
ISBN:
9780073373843
Author:
Frank D. Petruzella
Publisher:
McGraw-Hill Education

Fundamentals of Electric Circuits
Electrical Engineering
ISBN:
9780078028229
Author:
Charles K Alexander, Matthew Sadiku
Publisher:
McGraw-Hill Education

Electric Circuits. (11th Edition)
Electrical Engineering
ISBN:
9780134746968
Author:
James W. Nilsson, Susan Riedel
Publisher:
PEARSON

Engineering Electromagnetics
Electrical Engineering
ISBN:
9780078028151
Author:
Hayt, William H. (william Hart), Jr, BUCK, John A.
Publisher:
Mcgraw-hill Education,