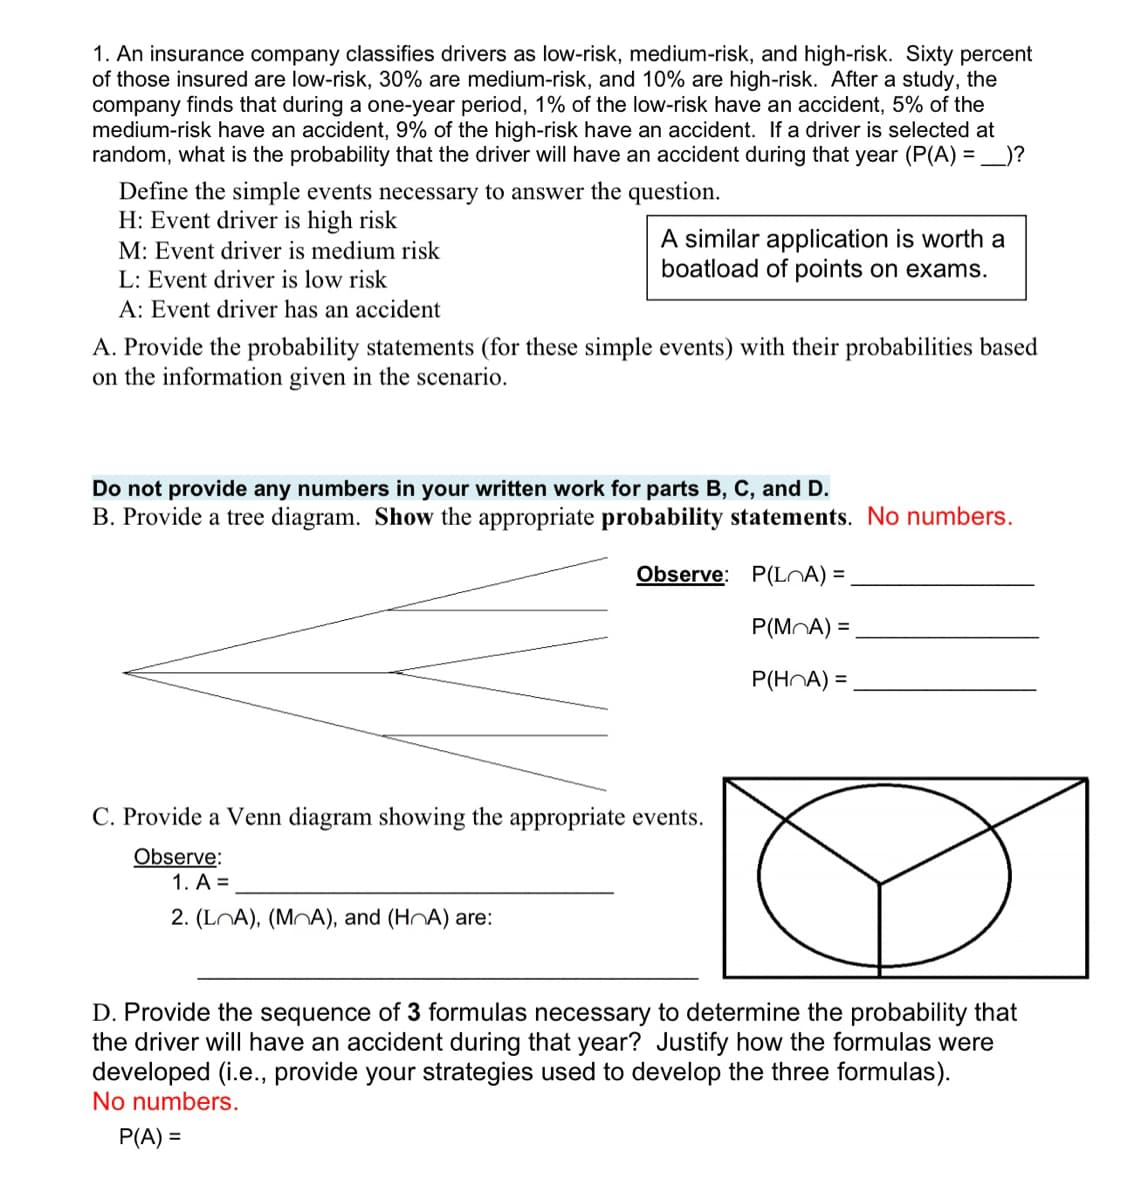
1. An insurance company classifies drivers as low-risk, medium-risk, and high-risk. Sixty percent of those insured are low-risk, 30% are medium-risk, and 10% are high-risk. After a study, the company finds that during a one-year period, 1% of the low-risk have an accident, 5% of the medium-risk have an accident, 9% of the high-risk have an accident. If a driver is selected at random, what is the probability that the driver will have an accident during that year (P(A) = ___)? Define the simple events necessary to answer the question. H: Event driver is high risk M: Event driver is medium risk L: Event driver is low risk A: Event driver has an accident A similar application is worth a boatload of points on exams. A. Provide the probability statements (for these simple events) with their probabilities based on the information given in the scenario.
1. An insurance company classifies drivers as low-risk, medium-risk, and high-risk. Sixty percent of those insured are low-risk, 30% are medium-risk, and 10% are high-risk. After a study, the company finds that during a one-year period, 1% of the low-risk have an accident, 5% of the medium-risk have an accident, 9% of the high-risk have an accident. If a driver is selected at random, what is the probability that the driver will have an accident during that year (P(A) = ___)? Define the simple events necessary to answer the question. H: Event driver is high risk M: Event driver is medium risk L: Event driver is low risk A: Event driver has an accident A similar application is worth a boatload of points on exams. A. Provide the probability statements (for these simple events) with their probabilities based on the information given in the scenario.

Linear Algebra: A Modern Introduction
4th Edition
ISBN:9781285463247
Author:David Poole
Publisher:David Poole
Chapter2: Systems Of Linear Equations
Section2.4: Applications
Problem 28EQ

Related questions
Question
100%
Transcribed Image Text:1. An insurance company classifies drivers as low-risk, medium-risk, and high-risk. Sixty percent
of those insured are low-risk, 30% are medium-risk, and 10% are high-risk. After a study, the
company finds that during a one-year period, 1% of the low-risk have an accident, 5% of the
medium-risk have an accident, 9% of the high-risk have an accident. If a driver is selected at
random, what is the probability that the driver will have an accident during that year (P(A) = ___)?
Define the simple events necessary to answer the question.
H: Event driver is high risk
M: Event driver is medium risk
L: Event driver is low risk
A: Event driver has an accident
A similar application is worth a
boatload of points on exams.
A. Provide the probability statements (for these simple events) with their probabilities based
on the information given in the scenario.
Do not provide any numbers in your written work for parts B, C, and D.
B. Provide a tree diagram. Show the appropriate probability statements. No numbers.
Observe:
P(LOA) =
P(MOA) =
P(HA) =
C. Provide a Venn diagram showing the appropriate events.
Observe:
1. A =
2. (LOA), (MOA), and (HA) are:
D. Provide the sequence of 3 formulas necessary to determine the probability that
the driver will have an accident during that year? Justify how the formulas were
developed (i.e., provide your strategies used to develop the three formulas).
No numbers.
P(A) =
Expert Solution
This question has been solved!
Explore an expertly crafted, step-by-step solution for a thorough understanding of key concepts.

This is a popular solution!

Trending now
This is a popular solution!

Step by step
Solved in 2 steps with 2 images

Recommended textbooks for you
Linear Algebra: A Modern Introduction
Algebra
ISBN:
9781285463247
Author:
David Poole
Publisher:
Cengage Learning

Glencoe Algebra 1, Student Edition, 9780079039897…
Algebra
ISBN:
9780079039897
Author:
Carter
Publisher:
McGraw Hill

Holt Mcdougal Larson Pre-algebra: Student Edition…
Algebra
ISBN:
9780547587776
Author:
HOLT MCDOUGAL
Publisher:
HOLT MCDOUGAL
Linear Algebra: A Modern Introduction
Algebra
ISBN:
9781285463247
Author:
David Poole
Publisher:
Cengage Learning
Glencoe Algebra 1, Student Edition, 9780079039897…
Algebra
ISBN:
9780079039897
Author:
Carter
Publisher:
McGraw Hill
Holt Mcdougal Larson Pre-algebra: Student Edition…
Algebra
ISBN:
9780547587776
Author:
HOLT MCDOUGAL
Publisher:
HOLT MCDOUGAL