1. (Drawn from exercise 3.3 of Bodine et al) Consider the following data on the number of eastern bluebirds recorded in a survey from 1970 to 2010. Year No. of Eastern Bluebird 1970 200 1975 300 1980 125 1985 250 1990 425 1995 450 2000 575 2005 675 2010 500 a) Make a scatter plot of the number of birds vs. year record. b) Create a table with this data that compares Years Since 1900 vs. the number of birds. Fill in extra columns for Years-Since-Squared and Years*Birds. Complete the table by adding rows for column totals and column averages. c) Calculate the linear regression for this model. d) Calculate the correlation coefficient for this model. e) Translate your linear regression so that the model is now Year vs. Number of birds. f) Add the model to your scatter plot. g) Compute the residual errors for your model. h) Plot your residual errors. i) Interpolate your model to find the number of birds in 1983 and 2001.


1.
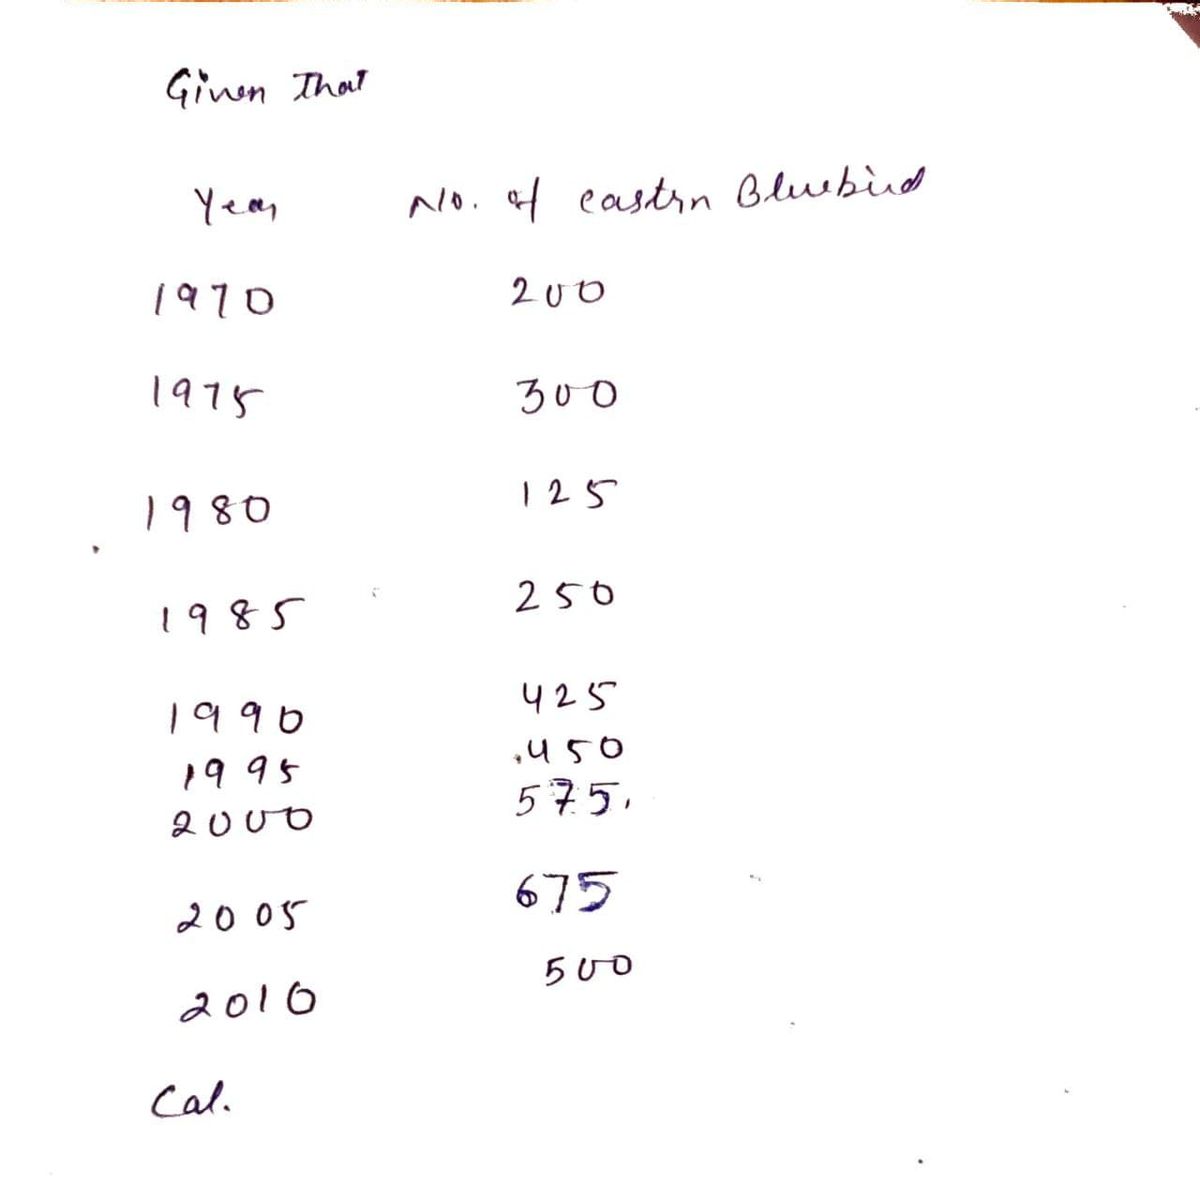
(Drawn from exercise 3.3 of Bodine et al) Consider the following data on the number of eastern bluebirds recorded in a survey from 1970 to 2010.
| Year | No. of Eastern Bluebird |
| 1970 | 200 |
| 1975 | 300 |
| 1980 | 125 |
| 1985 | 250 |
| 1990 | 425 |
| 1995 | 450 |
| 2000 | 575 |
| 2005 | 675 |
| 2010 | 500 |
a) Make a
b) Create a table with this data that compares Years Since 1900 vs. the number of birds. Fill in extra columns for Years-Since-Squared and Years*Birds. Complete the table by adding rows for column totals and column averages.
c) Calculate the linear regression for this model.
d) Calculate the
e) Translate your linear regression so that the model is now Year vs. Number of birds.
f) Add the model to your scatter plot.
g) Compute the residual errors for your model.
h) Plot your residual errors.
i) Interpolate your model to find the number of birds in 1983 and 2001.

Step by step
Solved in 4 steps with 4 images

