1. For each of the two position versus time graphs below, sketch the corresponding velocity and acceleration versus time graphs in the blank axes below each graph. Be sure to label both axes of each graph with the correct scale. 2.0 1.5 1.0 0.5 2. 15 0.0 10 4. 6. B. Time (s) Time (s) Position (m)
1. For each of the two position versus time graphs below, sketch the corresponding velocity and acceleration versus time graphs in the blank axes below each graph. Be sure to label both axes of each graph with the correct scale. 2.0 1.5 1.0 0.5 2. 15 0.0 10 4. 6. B. Time (s) Time (s) Position (m)

Related questions
Question
Please complete the graph and explain. I will be very thankful to you. God bless you. Please answer as soon as possible.
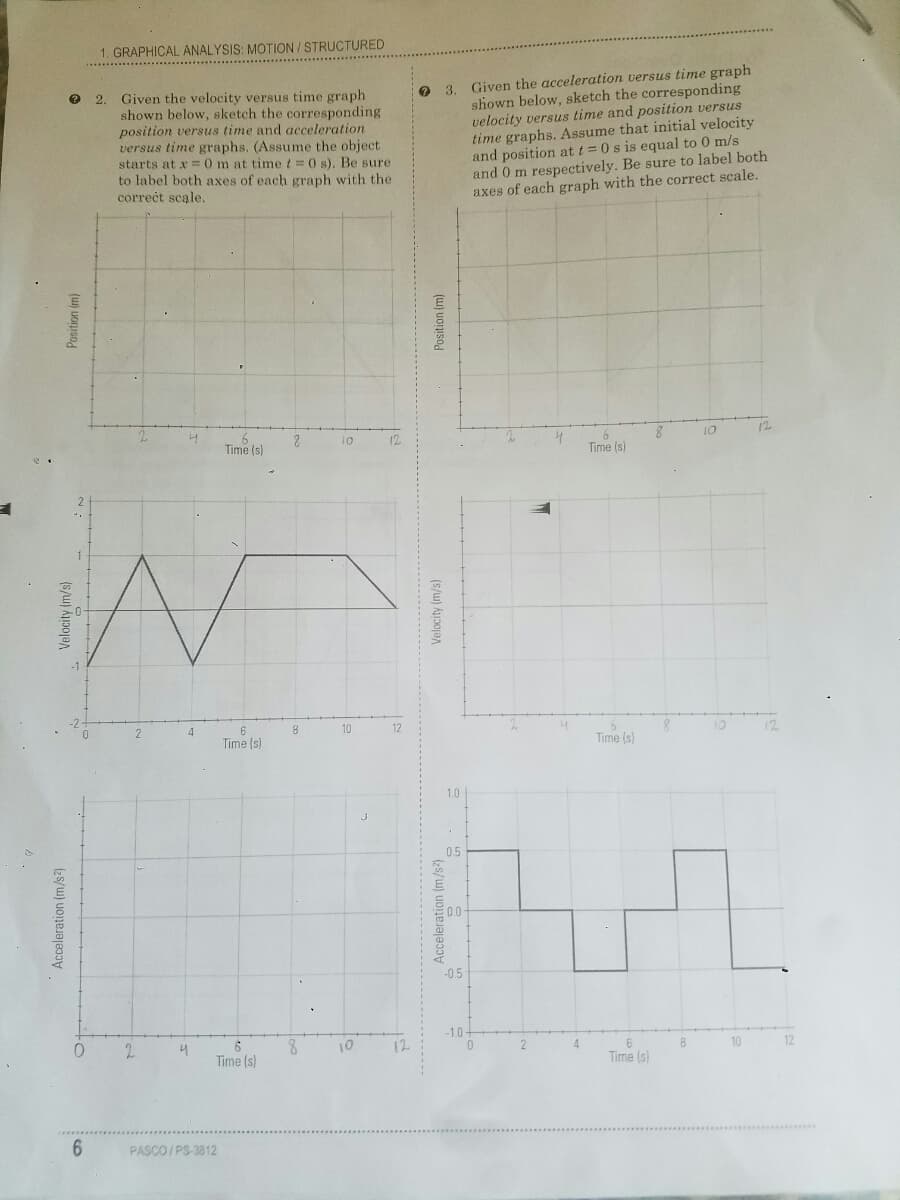
Transcribed Image Text:1. GRAPHICAL ANALYSIS: MOTION / STRUCTURED
O 3. Given the acceleration versus time graph
shown below, sketch the corresponding
velocity versus time and position versus
time graphs. Assume that initial velocity
and position at t = 0 s is equal to 0 m/s
and 0 m respectively. Be sure to label both
axes of each graph with the correct scale.
2.
Given the velocity versus time graph
shown below, sketch the corresponding
position versus time and acceleration
versus time graphs. (Assume the object
starts at x =0 m at time t=0 s). Be sure
to label both axes of each graph with the
correct scale.
10
10
Time (s)
Time (s)
8.
10
12
Time (s)
Time (s)
1.0
0.5
-0.5
-1.0-
2.
4
Time (s)
10
12
8
10
Time (s)
6.
PASCO/PS-3812
Acceleration (m/s
Velocity (m/s)
(u) uoniso,
Transcribed Image Text:1. GRAPHICAL ANALYSIS: MOTION/STRUCTURED
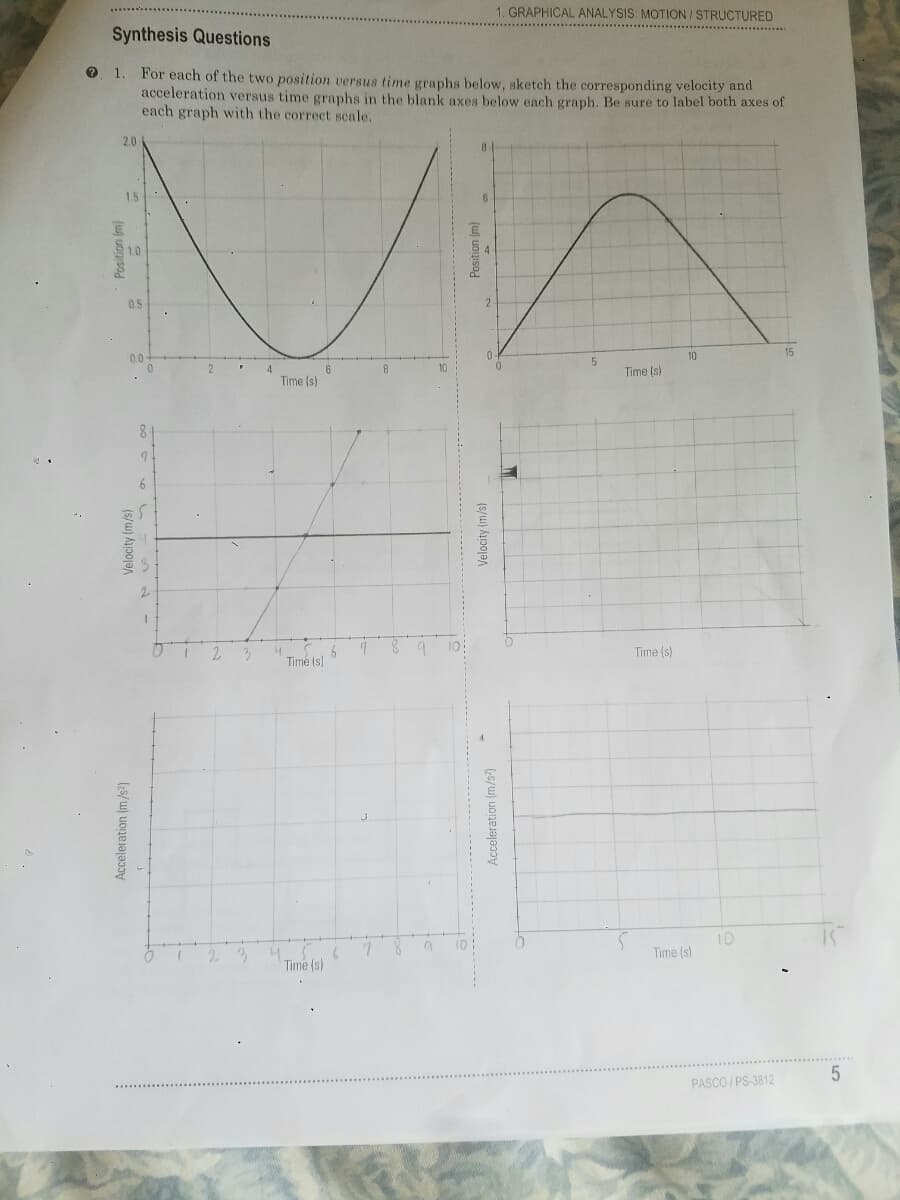
Synthesis Questions
0 1. For each of the two position versus time graphs below, sketch the corresponding velocity and
acceleration versus time graphs in the blank axes below each graph. Be sure to label both axes of
each graph with the correct scale.
2.0
1.5
1.0
0.5
2
15
0.0
10
Time (s)
Time (s)
8 9
Time (s)
Timé (s)
10
10
Time (s)
Time (s)
PASCO / PS-3812
Acceleration (m/s2)
Velocity (m/s)
Acceleration (m/s) -
Velocity (m/s)
Expert Solution
This question has been solved!
Explore an expertly crafted, step-by-step solution for a thorough understanding of key concepts.

This is a popular solution!

Trending now
This is a popular solution!

Step by step
Solved in 4 steps with 5 images
