1. how much money will you have at the end of 20 years if you save $4,000 every year for those twenty years and earn 12% every year? 2. Let's say you have just retired and you have $1 million saved. Your desire is to die broke. You will draw out $121,930.25 each year to live on. Assuming you earn 10%a year on any money you haven't drawn out, at the end of which year will you run out of money ? (and that's when you should die). Give your answer as a number such as 11 and not 11th
1. how much money will you have at the end of 20 years if you save $4,000 every year for those twenty years and earn 12% every year? 2. Let's say you have just retired and you have $1 million saved. Your desire is to die broke. You will draw out $121,930.25 each year to live on. Assuming you earn 10%a year on any money you haven't drawn out, at the end of which year will you run out of money ? (and that's when you should die). Give your answer as a number such as 11 and not 11th

Chapter1: Financial Statements And Business Decisions
Section: Chapter Questions
Problem 1Q

Related questions
Question
1. how much money will you have at the end of 20 years if you save $4,000 every year for those twenty years and earn 12% every year?
2. Let's say you have just retired and you have $1 million saved. Your desire is to die broke. You will draw out $121,930.25 each year to live on. Assuming you earn 10%a year on any money you haven't drawn out, at the end of which year will you run out of money ? (and that's when you should die). Give your answer as a number such as 11 and not 11th
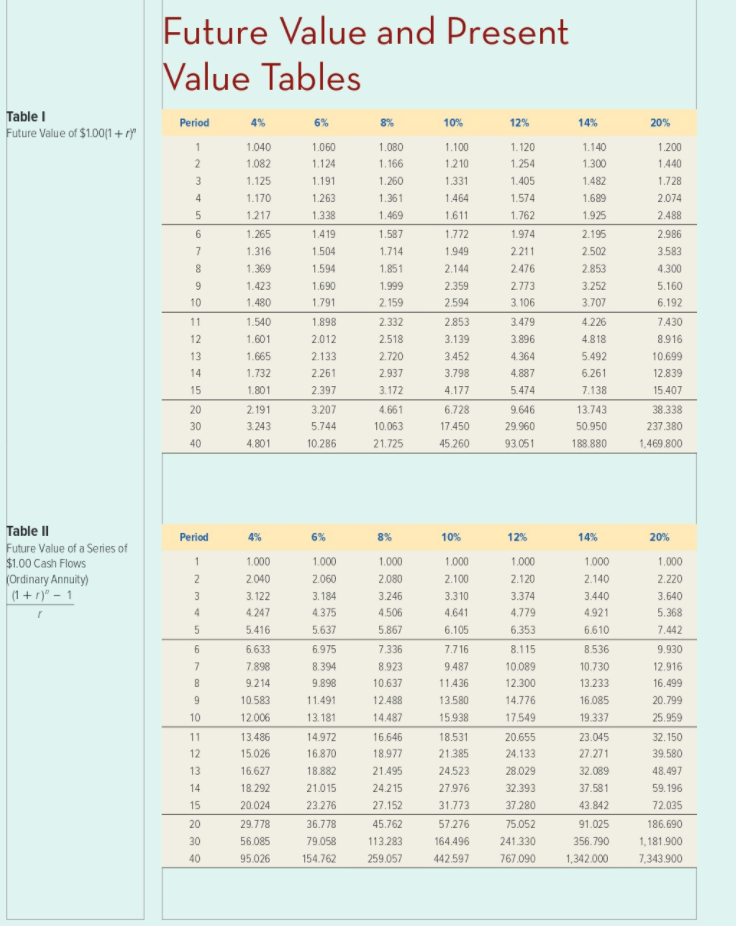
Transcribed Image Text:Future Value and Present
Value Tables
Table I
Period
6%
10%
12%
14%
20%
Future Value of $1.00(1+ ryp
1.040
1.060
1.080
1.100
1.120
1.140
1.200
1.082
1.124
1.166
1.210
1.254
1.300
1.440
3
1.125
1.191
1.260
1.331
1.405
1.482
1.728
1.170
1.263
1.361
1.464
1.574
1.689
2.074
1217
1.338
1.469
1.611
1.762
1.925
2.488
1.265
1.419
1.587
1.772
1.974
2.195
2.986
7
1.316
1.504
1.714
1.949
2211
2.502
3.583
1.369
1.594
1.851
2.144
2476
2.853
4.300
1.423
1.690
1.999
2.359
2.773
3.252
5.160
10
1.480
1.791
2.159
2.594
3. 106
3.707
6.192
11
1.540
1.898
2.332
2.853
3.479
4.226
7.430
12
1.601
2.012
2.518
3.139
3.896
4.818
8.916
13
1.665
2.133
2.720
3.452
4.364
5.492
10.699
14
1.732
2.261
2.937
3.798
4.887
6.261
12.839
15
1.801
2.397
3.172
4.177
5.474
7.138
15.407
20
2.191
3.207
4.661
6.728
9.646
13.743
38.338
30
3.243
5.744
10.063
17.450
29.960
50.950
237.380
40
4.801
10.286
21.725
45.260
93.051
188.880
1,469.800
Table II
Period
4%
6%
8%
10%
12%
14%
20%
Future Value of a Series of
$1.00 Cash Flows
(Ordinary Annuity)
(1 + r)° – 1
1.000
1.000
1.000
1.000
1.000
1.000
1.000
2.040
2.060
2.080
2.100
2.120
2.140
2.220
3
3.122
3.184
3.246
3.310
3.374
3.440
3.640
4.247
4.375
4.506
4.641
4.779
4.921
5.368
5.416
5.637
5.867
6.105
6.353
6.610
7.442
6.633
6.975
7.336
7.7 16
8.115
8.536
9.930
7
7.898
8.394
8.923
9.487
10.089
10.730
12.916
8
9.214
9.898
10.637
11.436
12.300
13.233
16.499
9
10.583
11.491
12.488
13.580
14.776
16.085
20.799
10
12.006
13.181
14.487
15.938
17.549
19.337
25.959
11
13.486
14.972
16.646
18.531
20.655
23.045
32.150
12
15.026
16.870
18.977
21.385
24.133
27.271
39.580
13
16.627
18.882
21.495
24.523
28.029
32.089
48.497
14
18.292
21.015
24.215
27.976
32.393
37.581
59.196
15
20.024
23.276
27.152
31.773
37.280
43.842
72.035
20
29.778
36.778
45.762
57.276
75.052
91.025
186.690
30
56.085
79.058
113.283
164.496
241.330
356.790
1,181.900
40
95.026
154.762
259.057
442.597
767.090
1,342.000
7,343.900
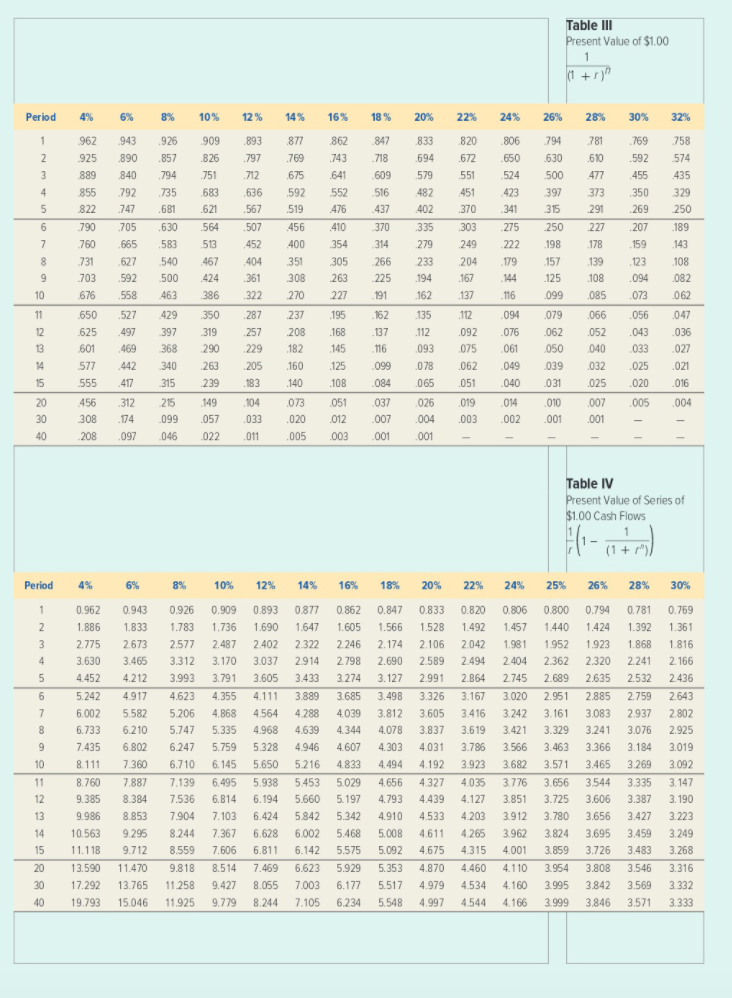
Transcribed Image Text:Table III
Present Value of $1.00
1
(1 +rn
Period
4%
6%
8%
10%
12 %
14%
16%
18 %
20%
22%
24%
26%
28%
30%
32%
962
943
.926
909
.893
877
862
847
833
820
.806
794
781
769
758
925
890
.857
826
797
769
743
718
694
.672
.650
630
.610
.592
574
3
889
840
794
751
712
675
641
.609
579
551
.524
500
477
455
435
4
855
792
735
683
636
592
552
516
482
451
423
397
373
350
329
5
822
747
.681
.621
.567
.519
476
437
402
370
341
315
291
269
250
790
705
.630
.564
.507
456
410
370
335
303
275
250
227
207
189
7
760
665
.583
513
452
400
354
314
279
249
222
198
178
159
143
731
.627
540
467
404
351
305
266
233
204
179
157
139
123
108
703
592
500
424
361
308
263
225
194
.167
144
.125
.108
.094
082
10
676
558
463
386
322
270
227
191
162
.137
.116
099
085
.073
062
11
.650
527
429
350
287
237
195
162
135
112
.094
079
.066
.056
.047
12
.625
497
397
319
257
208
.168
137
112
.092
076
062
.052
.043
.036
13
.601
469
368
290
.229
.182
145
116
093
075
.061
050
.040
.033
027
14
577
442
340
263
.205
.160
.125
.099
078
.062
.049
039
.032
.025
.021
15
555
417
315
239
.183
140
.108
.084
065
.051
.040
.031
.025
.020
.016
20
456
312
215
149
104
073
.051
.037
026
019
014
.010
.007
.005
.004
30
308
174
.099
057
.033
.020
.012
.007
.004
.003
.002
.001
.001
40
208
.097
046
.022
.011
.005
.003
001
.001
Table IV
Present Value of Series of
$1.00 Cash Flows
-
(1 + r")/
Period
4%
6%
8%
10%
12%
14%
16%
18%
20%
22%
24%
25%
26%
28%
30%
1
0.962
0.943
0.926
0.909
0.893
0.877
0.862
0.847
0.833
0.820
0.806
0.800
0.794
0.781
0.769
2
1.886
1.833
1.783
1.736
1.690
1.647
1.605
1.566
1.528
1.492
1.457
1.440
1.424
1.392
1.361
3
2.775
2.673
2.577
2.487
2.402
2.322
2.246
2.174
2.106
2.042
1.981
1.952
1.923
1.868
1.816
4
3.630
3.465
3.312
3.170
3.037
2.914
2.798
2.690
2.589
2.494
2.404
2.362
2.320
2.241
2.166
4.452
4.212
3.993
3.791
3.605
3.433
3.274
3.127
2.991
2.864
2.745
2.689
2.635
2.532
2.436
6.
5.242
4.917
4.623
4.355
4.111
3.889
3.685
3.498
3.326
3.167
3.020
2.951
2.885
2.759
2.643
6.002
5.582
5.206
4.868
4.564
4.288
4.039
3.812
3.605
3.416
3.242
3.161
3.083
2.937
2.802
8
6.733
6.210
5.747
5.335
4.968
4.639
4.344
4.078
3.837
3.619
3.421
3.329
3.241
3.076
2.925
9
7.435
6.802
6.247
5.759
5.328
4.946
4.607
4.303
4.031
3.796
3.566
3.463
3.366
3.184
3.019
10
8.111
7.360
6.710
6.145
5.650
5.216
4.833
4.494
4.192
3.923
3.682
3.571
3.465
3.269
3.092
11
8.760
7.887
7.139
6.495
5.938
5.453
5.029
4.656
4.327
4.035
3.776
3.656
3.544
3.335
3.147
12
9.385
8.384
7.536
6.814
6.194
5.660
5.197
4.793
4.439
4.127
3.851
3.725
3.606
3.387
3. 190
13
9.986
8.853
7.904
7.103
6.424
5.842
5.342
4.910
4.533
4.203
3.912
3.780
3.656
3.427
3.223
14
10.563
9.295
8.244
7.367
6.628
6.002
5.468
5.008
4.611
4.265
3.962
3.824
3.695
3.459
3.249
15
11.118
9.712
8.559
7.606
6.811
6.142
5.575
5.092
4.675
4.315
4.001
3.859
3.726
3.483
3.268
20
13.590
11.470
9.818
8.514
7.469
6.623
5.929
5.353
4.870
4.460
4.110
3.954
3.808
3.546
3.316
30
17.292
13.765
11.258
9.427
8.055
7.003
6.177
5.517
4.979
4.534
4.160
3.995
3.842
3.569
3.332
40
19.793
15.046
11.925
9.779
8.244
7.105
6.234 5.548
4.997
4.544
4.166
3.999
3.846
3.571
3.333
Expert Solution
This question has been solved!
Explore an expertly crafted, step-by-step solution for a thorough understanding of key concepts.

This is a popular solution!

Trending now
This is a popular solution!

Step by step
Solved in 2 steps

Knowledge Booster


Learn more about
Need a deep-dive on the concept behind this application? Look no further. Learn more about this topic, accounting and related others by exploring similar questions and additional content below.Recommended textbooks for you

Accounting
Accounting
ISBN:
9781337272094
Author:
WARREN, Carl S., Reeve, James M., Duchac, Jonathan E.
Publisher:
Cengage Learning,

Accounting Information Systems
Accounting
ISBN:
9781337619202
Author:
Hall, James A.
Publisher:
Cengage Learning,
Accounting
Accounting
ISBN:
9781337272094
Author:
WARREN, Carl S., Reeve, James M., Duchac, Jonathan E.
Publisher:
Cengage Learning,
Accounting Information Systems
Accounting
ISBN:
9781337619202
Author:
Hall, James A.
Publisher:
Cengage Learning,

Horngren's Cost Accounting: A Managerial Emphasis…
Accounting
ISBN:
9780134475585
Author:
Srikant M. Datar, Madhav V. Rajan
Publisher:
PEARSON

Intermediate Accounting
Accounting
ISBN:
9781259722660
Author:
J. David Spiceland, Mark W. Nelson, Wayne M Thomas
Publisher:
McGraw-Hill Education

Financial and Managerial Accounting
Accounting
ISBN:
9781259726705
Author:
John J Wild, Ken W. Shaw, Barbara Chiappetta Fundamental Accounting Principles
Publisher:
McGraw-Hill Education