1. If we visualize the region having "top" and "bottom" boundaries, express each as functions of and provide the interval of -values that covers the entire region. "top" boundary g₂ (x) = "bottom" boundary 9₁(x) = interval of values that covers the region
1. If we visualize the region having "top" and "bottom" boundaries, express each as functions of and provide the interval of -values that covers the entire region. "top" boundary g₂ (x) = "bottom" boundary 9₁(x) = interval of values that covers the region

Algebra & Trigonometry with Analytic Geometry
13th Edition
ISBN:9781133382119
Author:Swokowski
Publisher:Swokowski
Chapter7: Analytic Trigonometry
Section7.6: The Inverse Trigonometric Functions
Problem 92E

Related questions
Question
Transcribed Image Text:7.
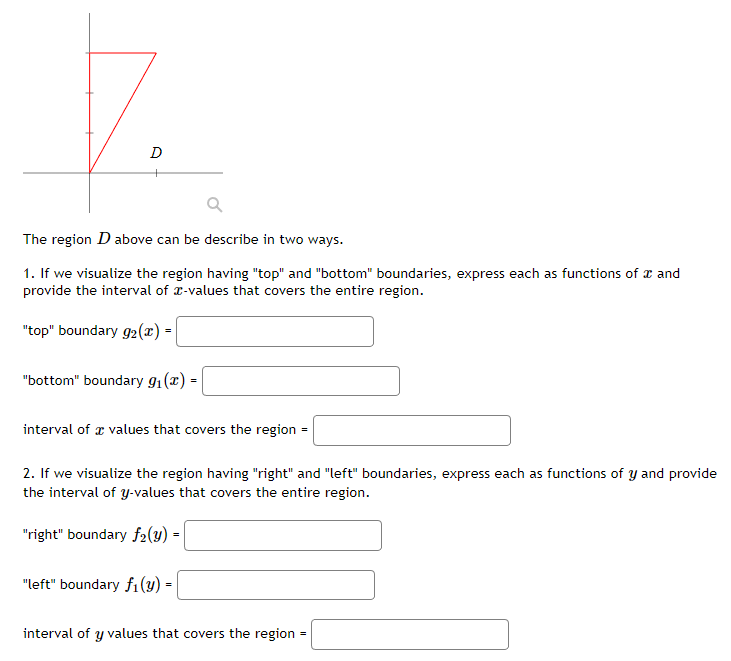
The region D above can be describe in two ways.
1. If we visualize the region having "top" and "bottom" boundaries, express each as functions of a and
provide the interval of -values that covers the entire region.
"top" boundary g2 (x) -
"bottom" boundary 9₁(x) =
interval of values that covers the region
2. If we visualize the region having "right" and "left" boundaries, express each as functions of y and provide
the interval of y-values that covers the entire region.
"right" boundary f2(y) =
"left" boundary f₁(y) =
interval of y values that covers the region
Expert Solution
This question has been solved!
Explore an expertly crafted, step-by-step solution for a thorough understanding of key concepts.

This is a popular solution!

Trending now
This is a popular solution!

Step by step
Solved in 4 steps with 3 images

Recommended textbooks for you
Algebra & Trigonometry with Analytic Geometry
Algebra
ISBN:
9781133382119
Author:
Swokowski
Publisher:
Cengage

Algebra & Trigonometry with Analytic Geometry
Algebra
ISBN:
9781133382119
Author:
Swokowski
Publisher:
Cengage