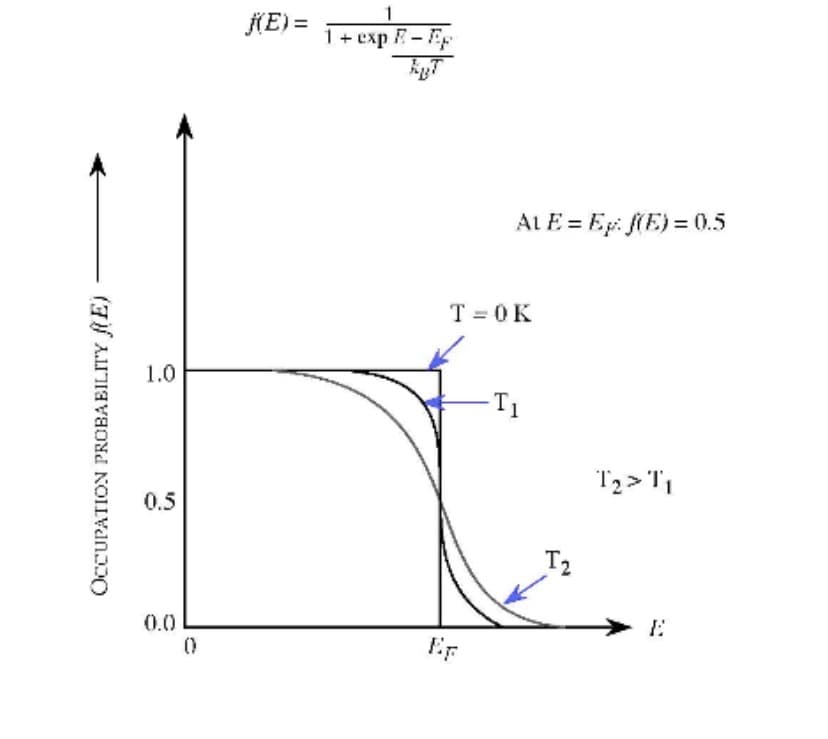
1. Plot the Fermi-Dirac probability of occupation function frp(E) for T = 0, 10, 100, 200, 300 and 400K.

Q: A charged particle (q = 1.602 x 10⁻¹⁹ C) has an initial velocity of 28,084 m/s to the right. it then...
A:
Q: A 5.00 kg partridge is suspended from a pear tree by anideal spring of negligible mass. When the par...
A: Given: The mass of partridge is m=5.00 kg. The maximum distance cover by partridge by pulling is A=...
Q: n moles of an ideal gas with adiabatic index y = 2 is taken through a cycle as shown in the figure t...
A: Hello. Since your question has multiple sub-parts, we will solve the first three sub-parts for you. ...
Q: How much work is needed to assemblean atomic nucleus containing three protons (such as Li) if we mod...
A: Given: The distance between each charge is d=2.00×10⁻¹⁵ m. Assume that one charge is placed at one...
Q: Please solve 2A and 2B
A: Given: Height of the Pyramid, H = 147m Edge length, L = 230 m Density, ρ = 1.8 x 10³ kg/m3...
Q: A cockroach of mass m lies on the rim of a uniform disk of mass 3.00 m that can rotate freely about ...
A:
Q: Calculate the speed of light in zircon, a material used in jewelry to imitate diamond.
A: Zircon is the type of gemstone which is made up of silicon, zirconium and oxygen. The refractive ind...
Q: An initially uncharged capacitor of 697 x 10-6 F is connected to a resistor. When the circuit is con...
A:
Q: Question in the attachments
A: Given, height of car = 18.5 cm iniital object distance = -6.41 cm final object distance = -91.4 cm...
Q: Obtain the direction and size of the magnetic field strength vector from the center of the ring when...
A: The magnitude of the magnetic field B at a perpendicular distance R from the center of a long straig...
Q: A very long, cylindrical wire of radius a has a circular hole of radius b in it at a distance d from...
A:
Q: A viewing window 30 cm in diameter is installed 3 m below the surface of an aquarium tank filled wit...
A: Force on the window F=∫dF=∫y=-ry=rρgh+r+y2xdy=∫y=-ry=r2ρgh+r+yr2-y2dy=∫y=-ry=r2ρgh+rr2-y2dy+∫y=-ry=r...
Q: Question 31 and 17, thank you in advance!
A:
Q: 7. Two converging lenses are arranged as in the figure on the right, separated by a distance d = 50....
A:
Q: =18.1 μΩ.) Find the equivalent resistance of the combination of resistors shown in the figure below....
A:
Q: please show all work with explanations
A:
Q: Generally speaking net torque will give rise to an angular acceleration a. Στ- ια (general equation)...
A:
Q: help on a to d please
A:
Q: Consider a single slit being illuminated by light with wavelength λ. Part (a) What is the minimum w...
A: Let w1min denotes the minimum width, m denotes the order, λ denotes the wavelength, and θ denotes th...
Q: Help needed with the two questions plz
A:
Q: What is the angular speed (in rad/s) of the rod and ball? What is the linear speed (in m/s) of the c...
A: According to the conservation of energy, the initial energy of the system can be written as Kf=UiKf=...
Q: Work Done by a Constant Force A particle moving in the xy-plane undergoes a displacement given by ař...
A: Given: The displacement vector ∆r = (1.9i + 3.3j) m. The force vector F = (5i + 2j) N.
Q: 1. Springs, Friction: The block shown is released from rest when the spring is stretched a distance ...
A:
Q: 3. Forces on an Incline: Find the speed of the crate at the bottom given the coefficient of kinetic ...
A:
Q: My question is visual
A:
Q: The figure below shows, at left, a solid flywheel of radius R = 0.600 m and mass 50.0 kg. Mounted di...
A:
Q: Please help
A:
Q: A truck is moving with constant velocity of 10 m/s up an incline that makes an angle of 10∘ with the...
A: A projectile is a substance that is thrown without any fuel. A projectile is generally projected at ...
Q: Three equal masses are located on a coordinate grid so that the masses and the origin form a square ...
A: Using field equation in vector notation
Q: Problem A new type of force was discovered by physicists with the following expression: a Enew = + B...
A: Given: The new type of force is, Fnew=αx+βex+3x4 α,β are constants, x is the position. Need to find ...
Q: An iron cylinder is hung from a string attached to a balance. The cylinder is completely submerged i...
A:
Q: A spring (massless) is attached to one end of a rope of mass m1 and length L1. The other end is tied...
A:
Q: You are in a rocketship in deep space accelerating upwards with acceleration A. At the top of an inc...
A: Given rocketship is accelerating upward with acceleration A. Block mass m moving on an inclined plan...
Q: (a) Find the maximum angular speed of the roller. ] rad/s (b) What is the maximum tangential speed o...
A: Since we only answer up to 3 sub-parts, we’ll answer the first 3. Please resubmit the question and s...
Q: Please help me on this
A: Hello. Since your question has multiple sub-parts, we will solve the first three sub-parts for you. ...
Q: A flywheel in the form of a uniformly thick disk of radius 1.53 m has a mass of 60.1 kg and spins co...
A: The radius of the disc r=1.53 m. The mass of the disc m=60.1 kg. The initial angular velocity of the...
Q: In a conductor, one or more electrons from each atom are free to roam throughout the volume of the c...
A: No, this does not contradict the statement about solid conductor that excess charges reside on the s...
Q: A car generating a power of 92477.9 watts is traveling on a road with a coefficient of kinetic frict...
A: Acceleration=Powermass×speed4.32=92477.9mass×33.02mass=648kg
Q: Question 2: From the following graph, calculate the approximate values of RC time constant when (a) ...
A: While charging - Time constant = time taken by capacitor to charge 63.2 % . While discharging - ...
Q: Multiple part question: On the game show Wheel of Fortune, the contestants take turns spinning a lar...
A: Given, initial angular speed = 0 rad/s full angular speed = 22 rev/ min
Q: The Scalar Product The vectors A and are given by A= 3i + 1j and B = -1i - 1j. (a) Determine the sca...
A: (a) The scalar product is, A→·B→=3i+1j·-1i+1jA→·B→=3i·-1i+3i·1 j+1j·-1i+1j·1jA→·B→=-3+0+0+1=-2


Step by step
Solved in 4 steps with 1 images
